Fig. 5
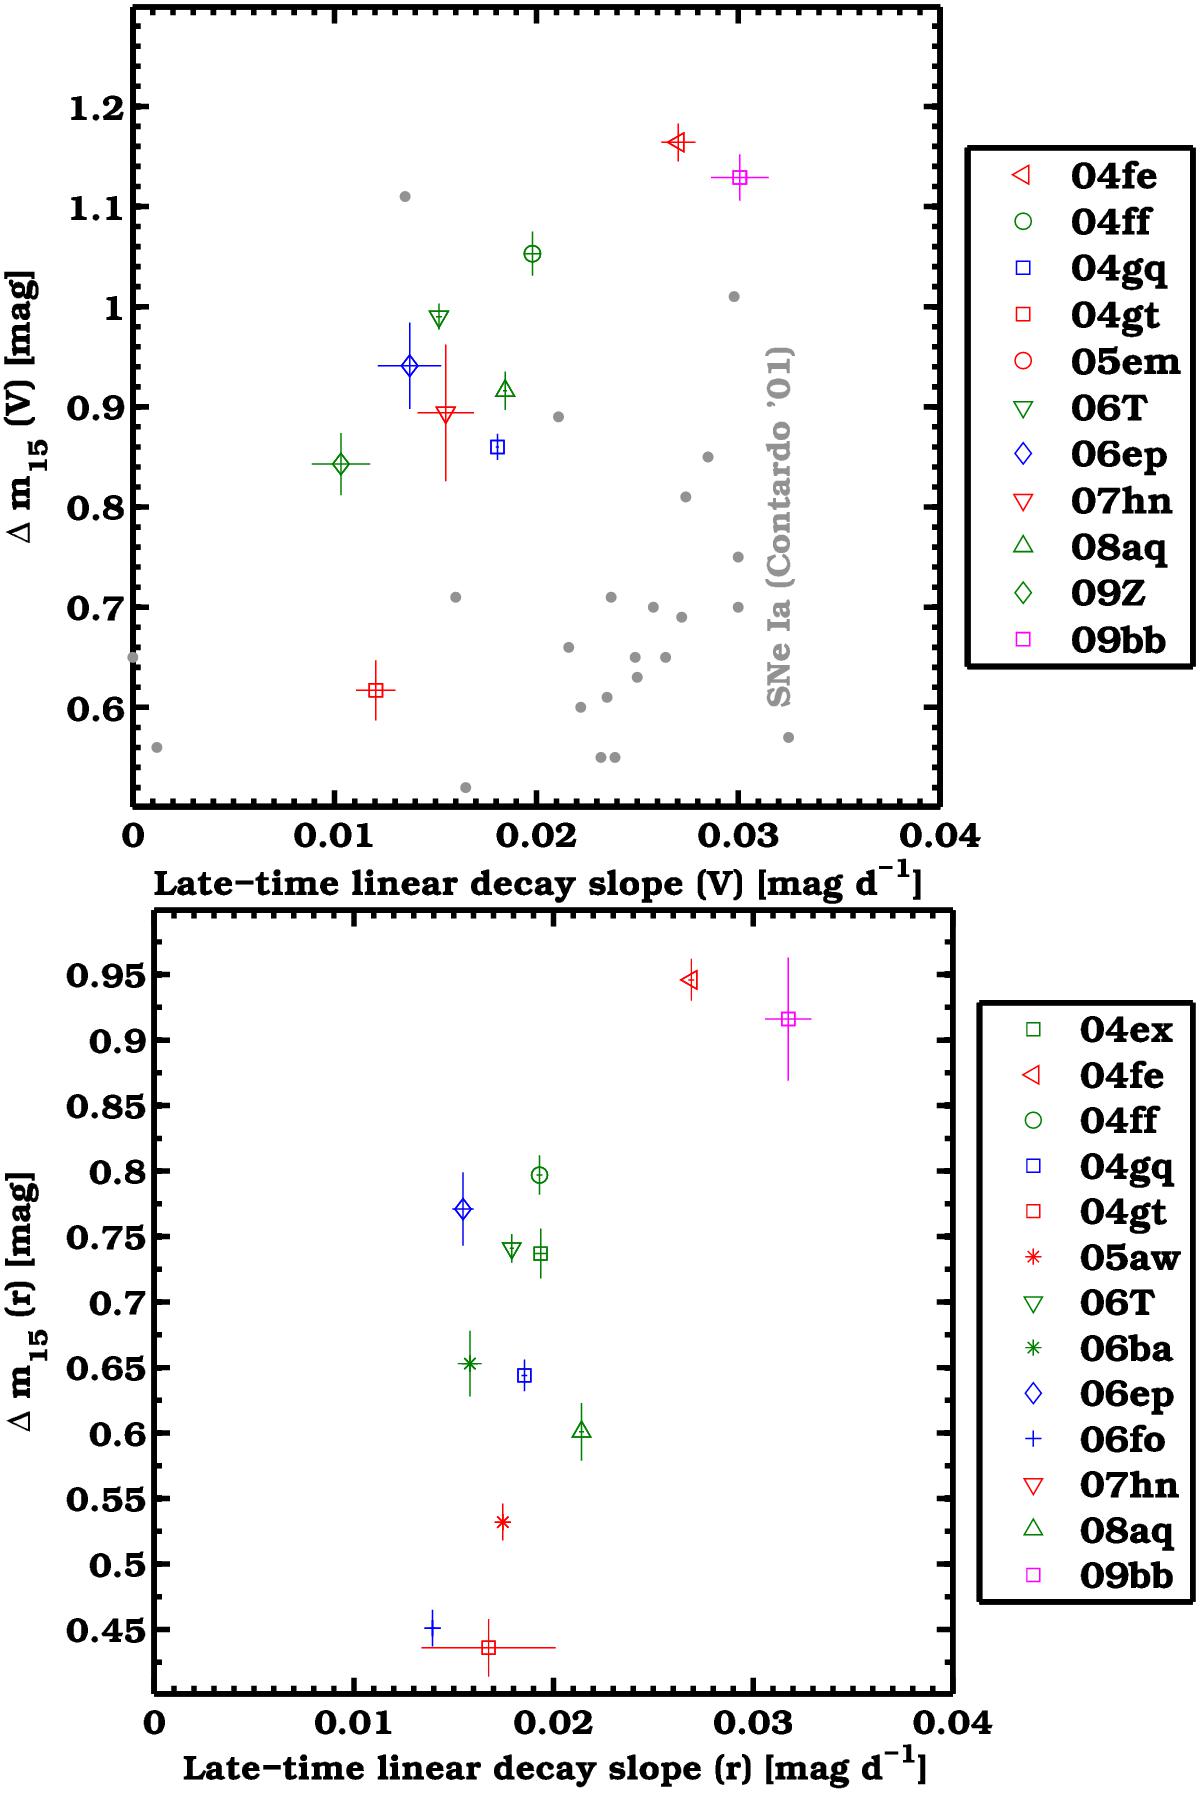
Late-time linear decay slope in V and r band versus Δm15 for the CSP-I SE SNe with both their peak luminosity covered and their last observation being >+40 d days post maximum. Faster declining light curves (higher Δm15) tend to decline faster at late phases. Objects with both large uncertainties on the slope and on Δm15 are excluded from the figure. SN IIb, Ib, Ic, and Ic-BL are represented in green, blue, red, and magenta, respectively. SN 2005em is not included and falls far from the correlation due to its large late-time slope. With gray points we represent the results for the SNe Ia fit by Contardo (2001), which do not show any clear trend.
Current usage metrics show cumulative count of Article Views (full-text article views including HTML views, PDF and ePub downloads, according to the available data) and Abstracts Views on Vision4Press platform.
Data correspond to usage on the plateform after 2015. The current usage metrics is available 48-96 hours after online publication and is updated daily on week days.
Initial download of the metrics may take a while.