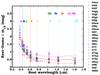
Fig. 4
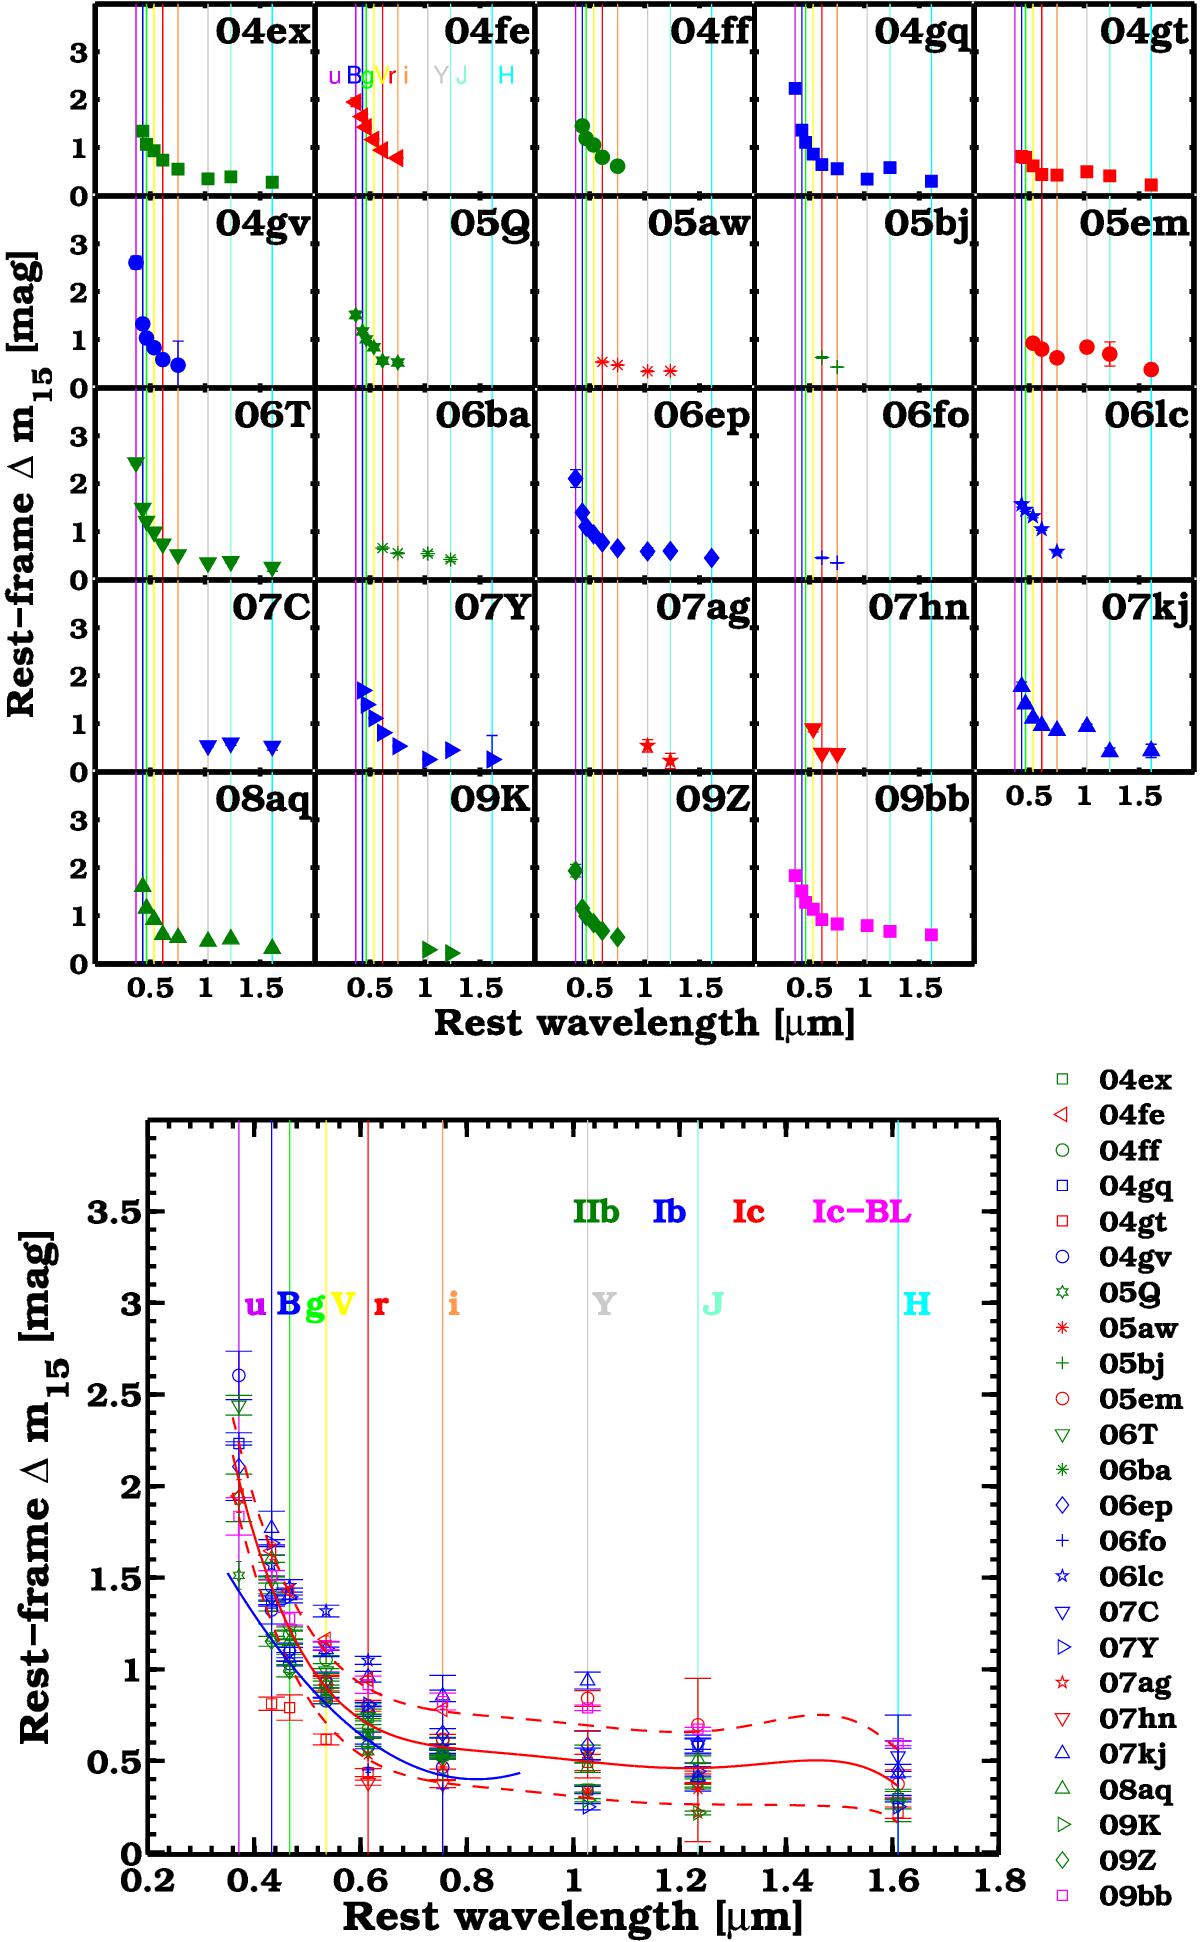
Top panel: light-curve decline-rate parameter, Δm15, plotted as a function of wavelength where the effective wavelengths of the CSP passbands are indicated by vertical lines. At optical wavelengths the blue bands exhibit larger Δm15 values than the red bands, while in the NIR Δm15 is similar among the different bands. Bottom panel: same as in the top panel but with all SNe plotted in one panel, along with a low-order polynomial fit (solid red line) and its associated 1σ uncertainty (≈0.2 mag; dashed red line). The functional form of the polynomial fit is given by: Δm15(λ) = −11.88λ5 + 63.74λ4−134.17λ3 + 138.81λ2−71.00λ + 15.00. Here λ is in units of μm and Δm15 in units of magnitude. Shown in blue is a polynomial fit obtained from the same analysis of the SDSS-II SE SN sample (Taddia et al. 2015).
Current usage metrics show cumulative count of Article Views (full-text article views including HTML views, PDF and ePub downloads, according to the available data) and Abstracts Views on Vision4Press platform.
Data correspond to usage on the plateform after 2015. The current usage metrics is available 48-96 hours after online publication and is updated daily on week days.
Initial download of the metrics may take a while.