Fig. 3
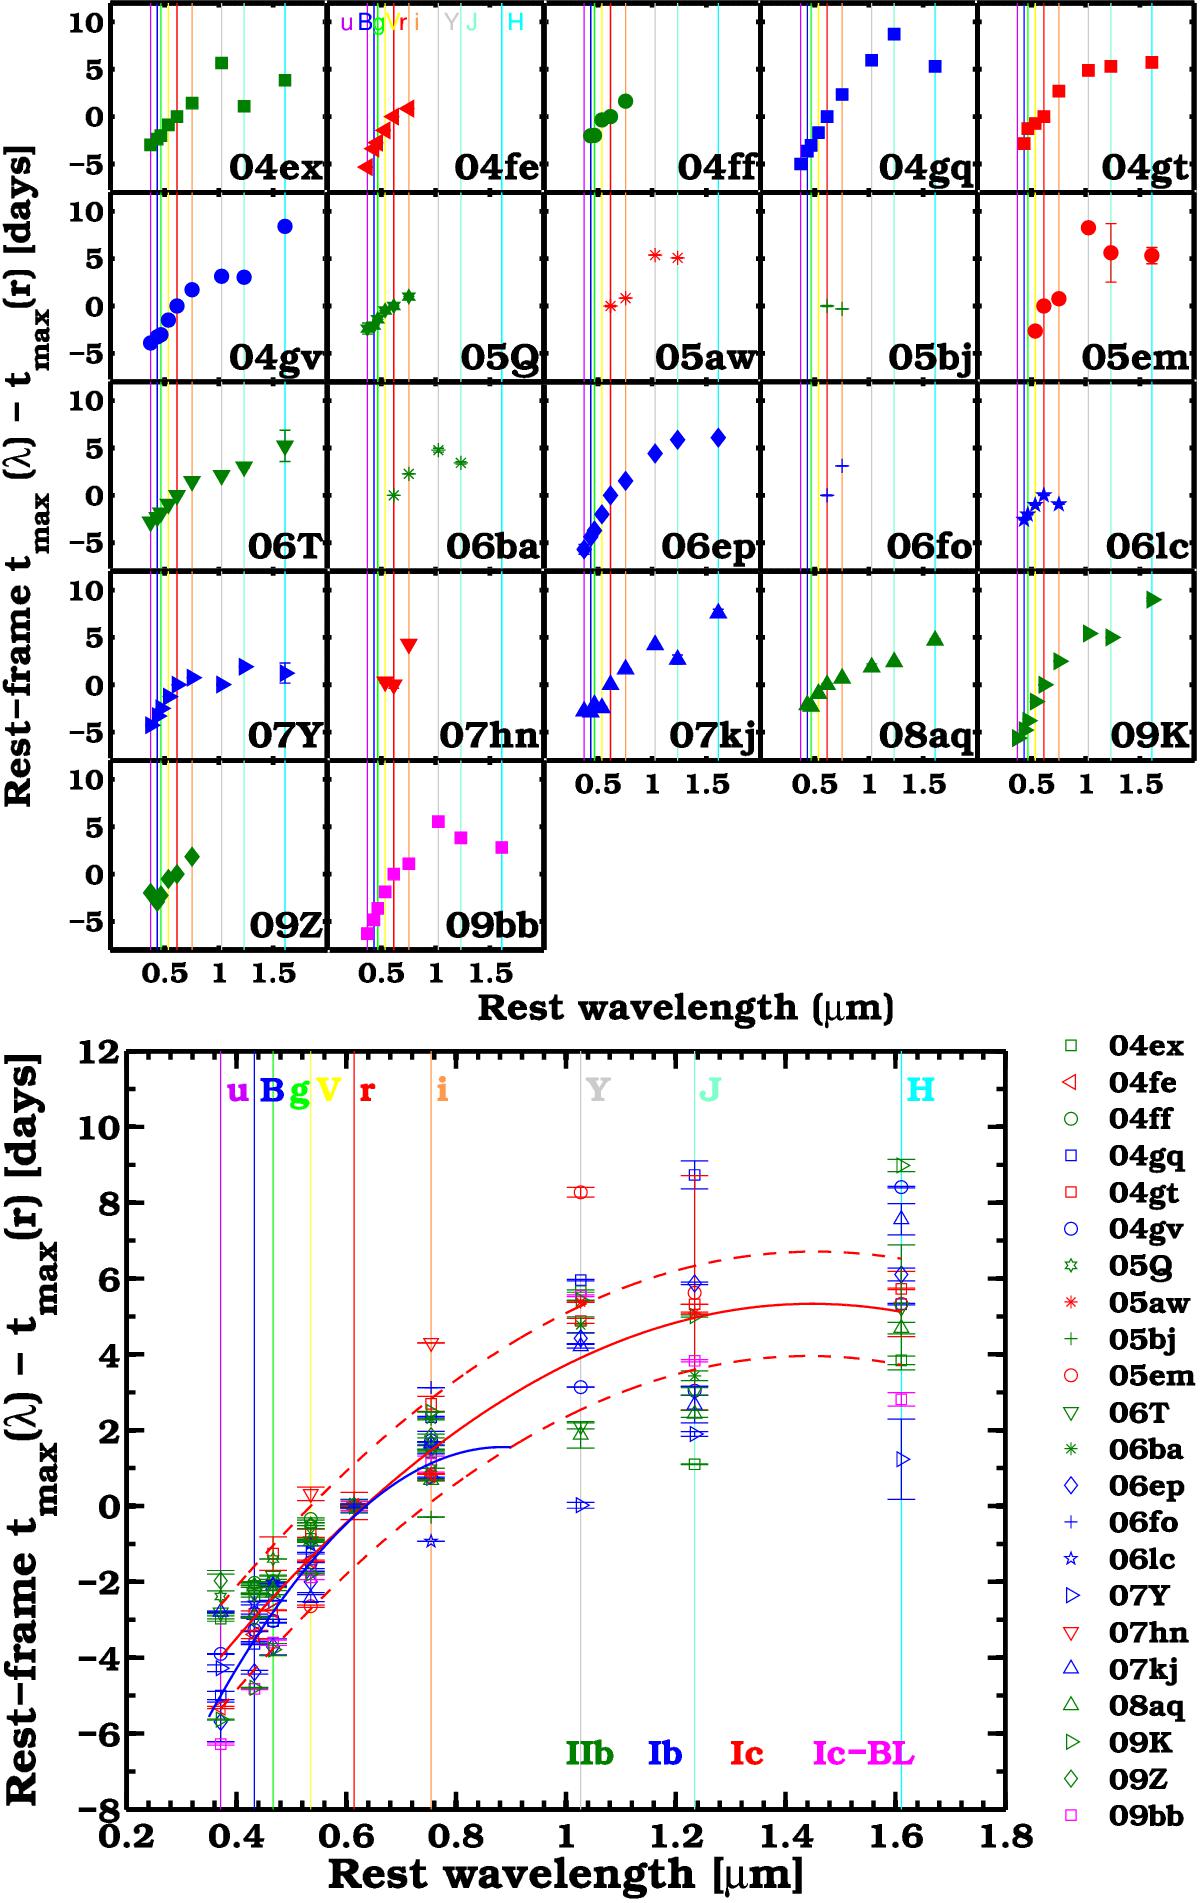
Top panel: epoch of maximum light (relative to tmax in the r band) as a function of wavelength, where the effective wavelengths of the CSP-I passbands are indicated with solid vertical lines. Included here are 22 objects whose light curves cover the r-band maximum. The SE SN subtype of each object is indicated by the color of its name with green, blue, red, and magenta corresponding to Type IIb, Type Ib, Type Ic, and Type Ic-BL, respectively. Bluer optical bands peak prior to redder optical bands, while in the NIR, tmax is nearly coeval amongst the Y, J, and H passbands. Bottom panel: same as in the top panel, but here all the SNe are plotted together. The red solid line corresponds to a low-order polynomial fit, with the associated fit uncertainty of ≈1.4 days indicated by dashed red lines. The functional form of the polynomial fit is: tmax(λ)−tmax(r) = −8.0285λ2 + 23.234λ−11.476, with time in days and λ in μm. The solid blue line corresponds to the polynomial fit obtained from the SDSS-II SE SN sample (Taddia et al. 2015).
Current usage metrics show cumulative count of Article Views (full-text article views including HTML views, PDF and ePub downloads, according to the available data) and Abstracts Views on Vision4Press platform.
Data correspond to usage on the plateform after 2015. The current usage metrics is available 48-96 hours after online publication and is updated daily on week days.
Initial download of the metrics may take a while.