Fig. 2
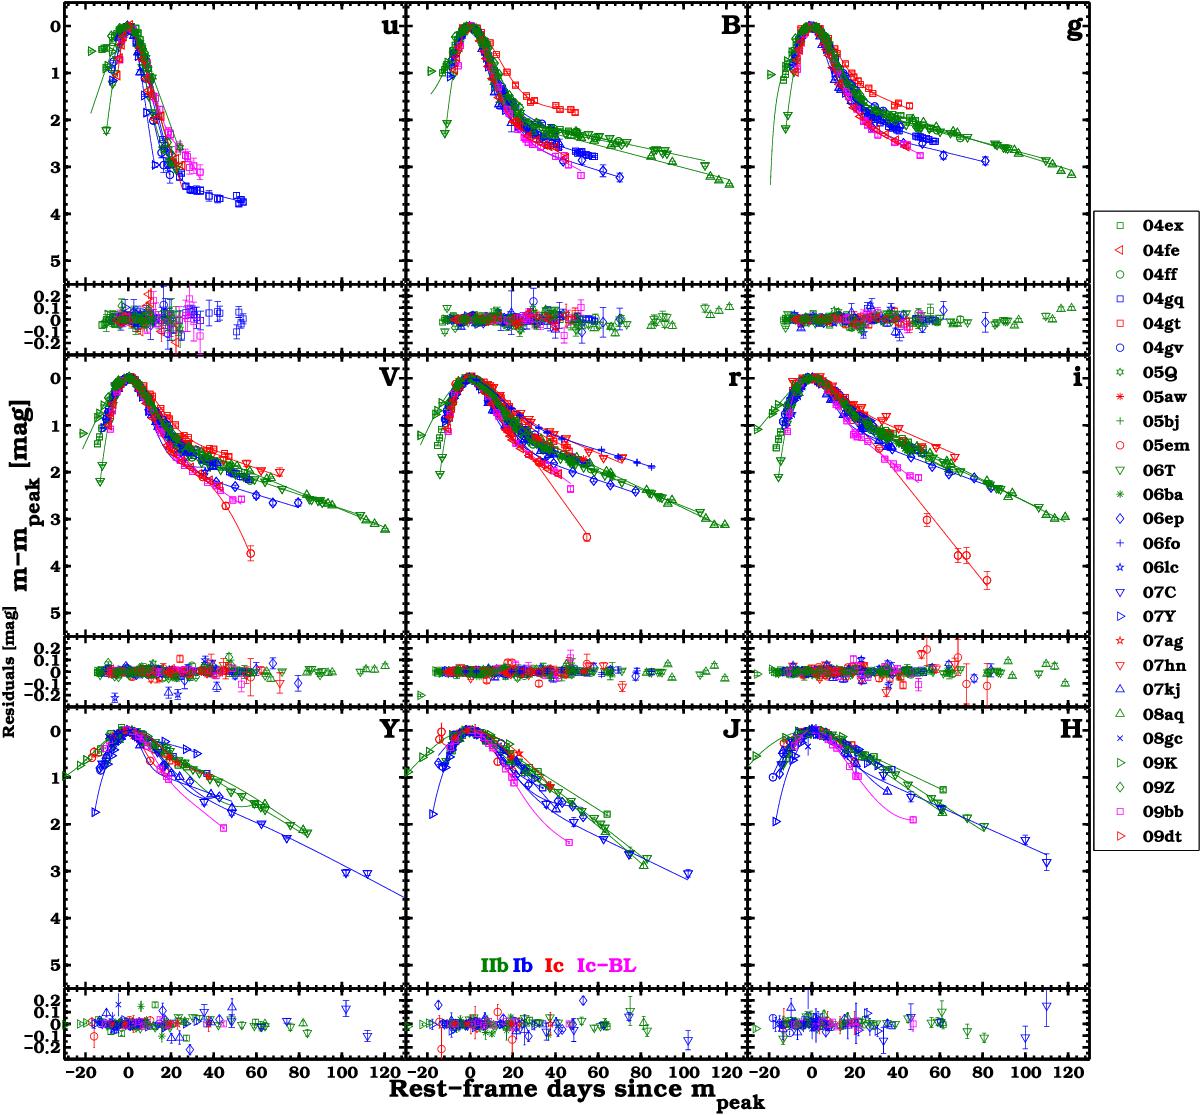
Light curves in u- to H-band of 26 SE SNe with data obtained prior to tmax in at least one band. Each filtered light curve is normalized to peak brightness and aligned to tmax estimated from the best fit of Eq. (1)(colored solid lines) to the observed photometry. Shown below each light-curve panel are the residuals of the light-curve fits. Objects are color-coded based on their subtype: SNe IIb are green, SNe Ib are blue, SNe Ic are red, and SNe Ic-BL are magenta.
Current usage metrics show cumulative count of Article Views (full-text article views including HTML views, PDF and ePub downloads, according to the available data) and Abstracts Views on Vision4Press platform.
Data correspond to usage on the plateform after 2015. The current usage metrics is available 48-96 hours after online publication and is updated daily on week days.
Initial download of the metrics may take a while.