Fig. 15
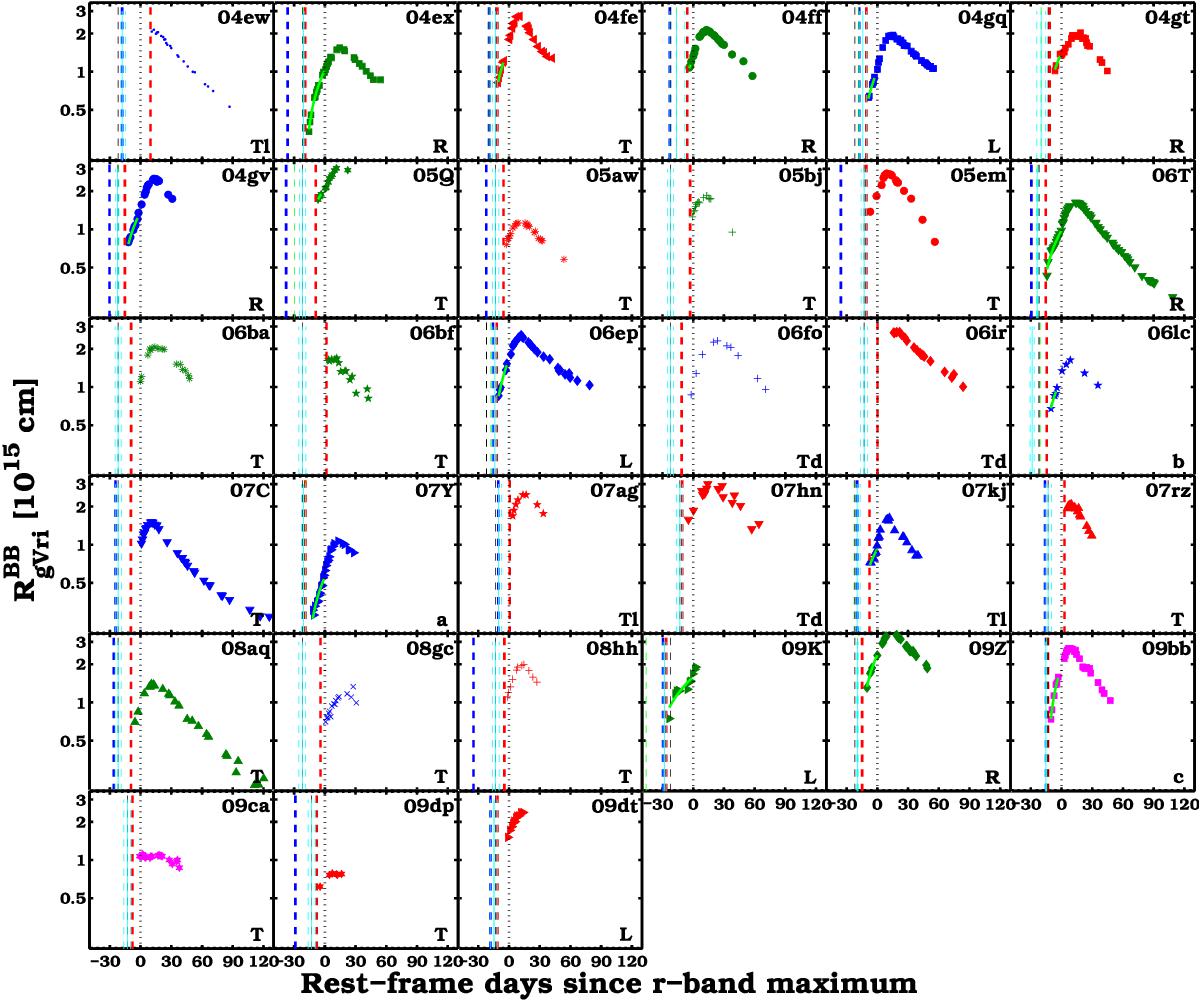
Illustration of the different techniques used to estimate the explosion epochs for the CSP-I SE SN sample. The photospheric radius as a function of days since r-band maximum is shown for each SN in each sub-panel. The epoch of r-band maximum is marked by a black dotted line, the last non-detection epoch is indicated by a thick, blue dashed line, and the discovery epoch is indicated by a thick, red dashed line. The pre-peak fit to the radius with a PL is indicated by a green solid line and the corresponding explosion epoch estimate is indicated with a green dashed line. The explosion epochs derived by assuming a specific rise time for each subtype are marked by a black dashed line. The best explosion epoch estimate obtained for each object is marked by a cyan solid line and its corresponding uncertainties with cyan dashed lines. The method used to obtain the explosion epoch are indicated in each sub-panel. The letter L corresponds to the use of pre-discovery limits, R corresponds to the use of a PL radius fit, T assumes a rise time; Tl marks the case of assuming the last non-detection epoch as the explosion epoch (as the assumed rise time would have implied a too early explosion as compared to the last non detection), and Td marks when the assumed rise time and discovery epoch are used to determine the uncertainty of the explosion epoch as it occurred close to the inferred explosion. Finally, a,b,c are estimates obtained from the literature (see Table 7). Each SN is color-coded so that SNe IIb, Ib, Ic, and Ic-BL are green, blue, red, and magenta, respectively.
Current usage metrics show cumulative count of Article Views (full-text article views including HTML views, PDF and ePub downloads, according to the available data) and Abstracts Views on Vision4Press platform.
Data correspond to usage on the plateform after 2015. The current usage metrics is available 48-96 hours after online publication and is updated daily on week days.
Initial download of the metrics may take a while.