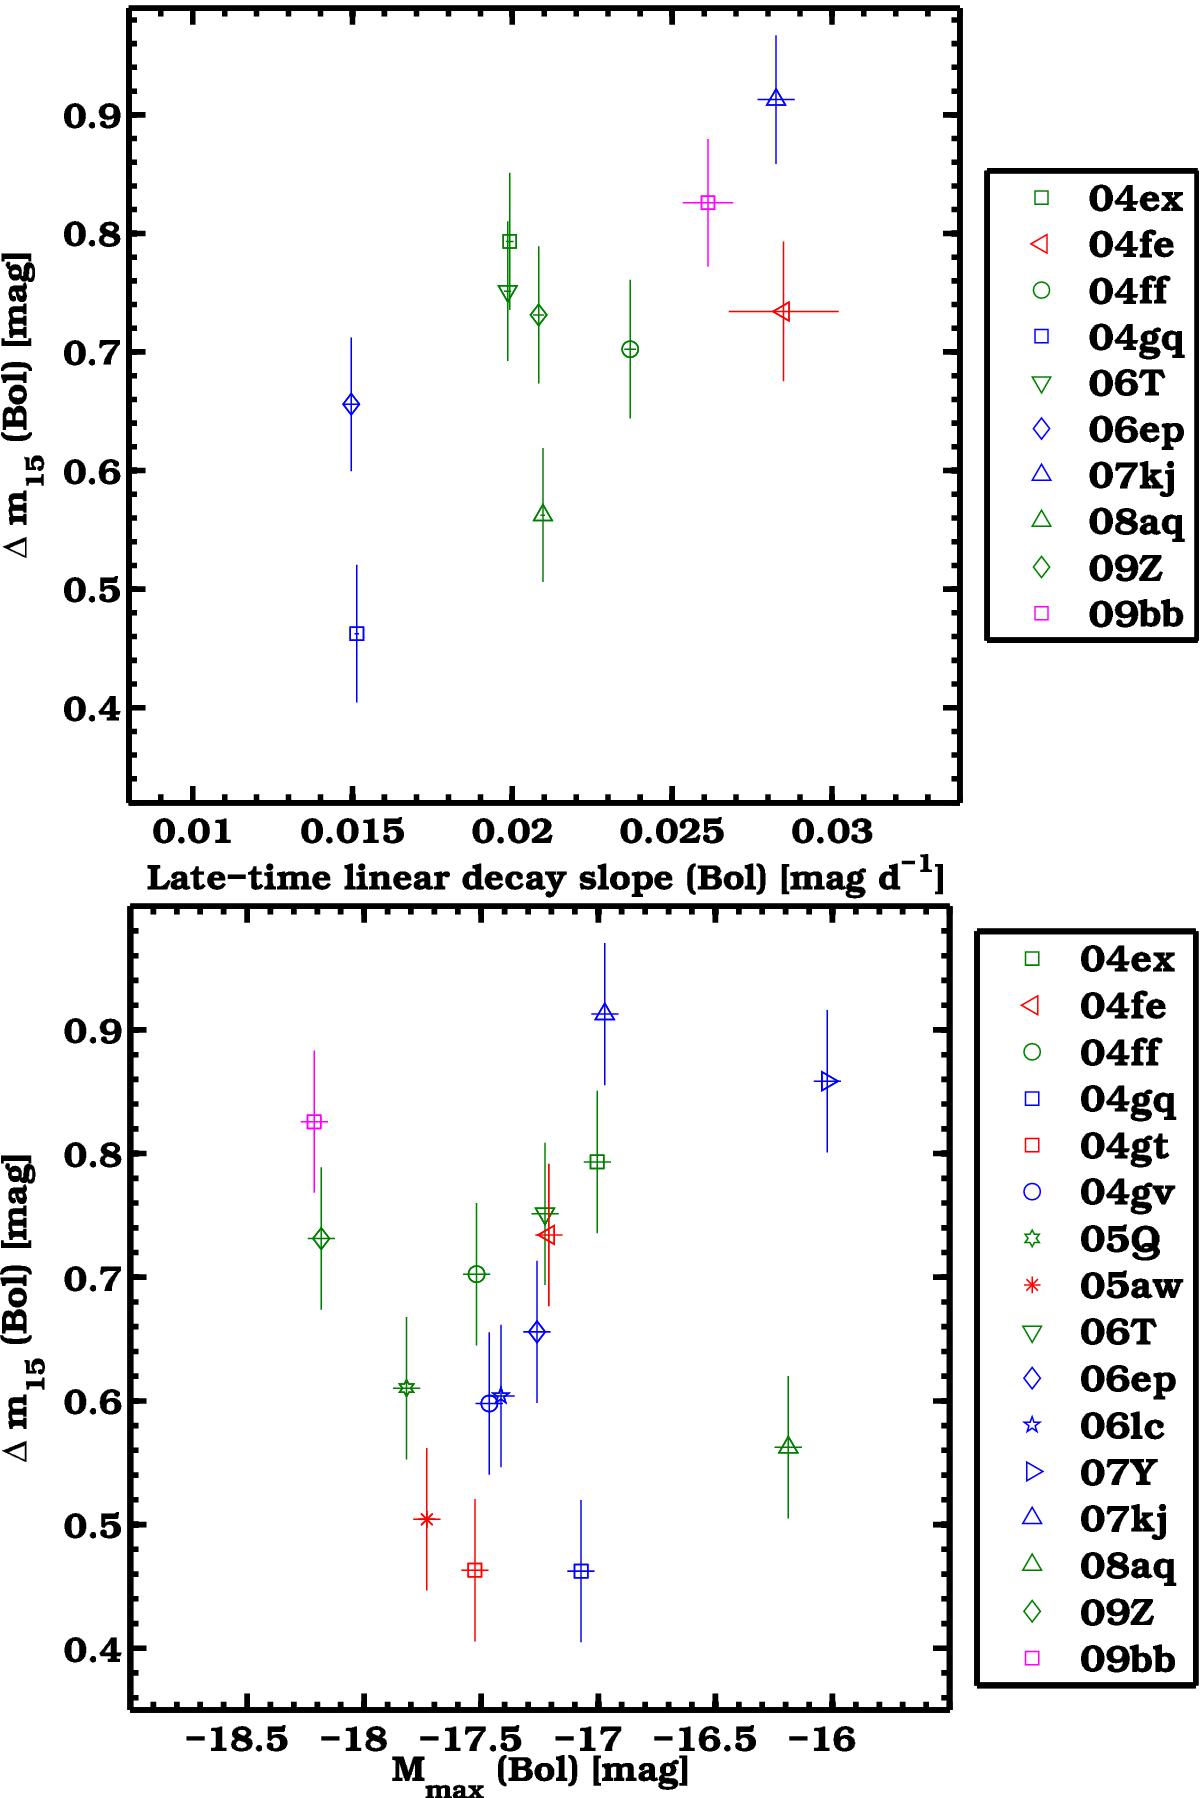
Fig. 13

The decline parameter Δm15 computed for the bolometric light curves versus the late-time linear decay slope (top panel) and the peak bolometric magnitude (bottom panel). A possible correlation is observed in the first case, which might be explained by a range of values of the EK/Mej ratio (see Sect. 5). SNe IIb, Ib, Ic, and Ic-BL are represented in green, blue, red, and magenta, respectively.
Current usage metrics show cumulative count of Article Views (full-text article views including HTML views, PDF and ePub downloads, according to the available data) and Abstracts Views on Vision4Press platform.
Data correspond to usage on the plateform after 2015. The current usage metrics is available 48-96 hours after online publication and is updated daily on week days.
Initial download of the metrics may take a while.


