Fig. 1
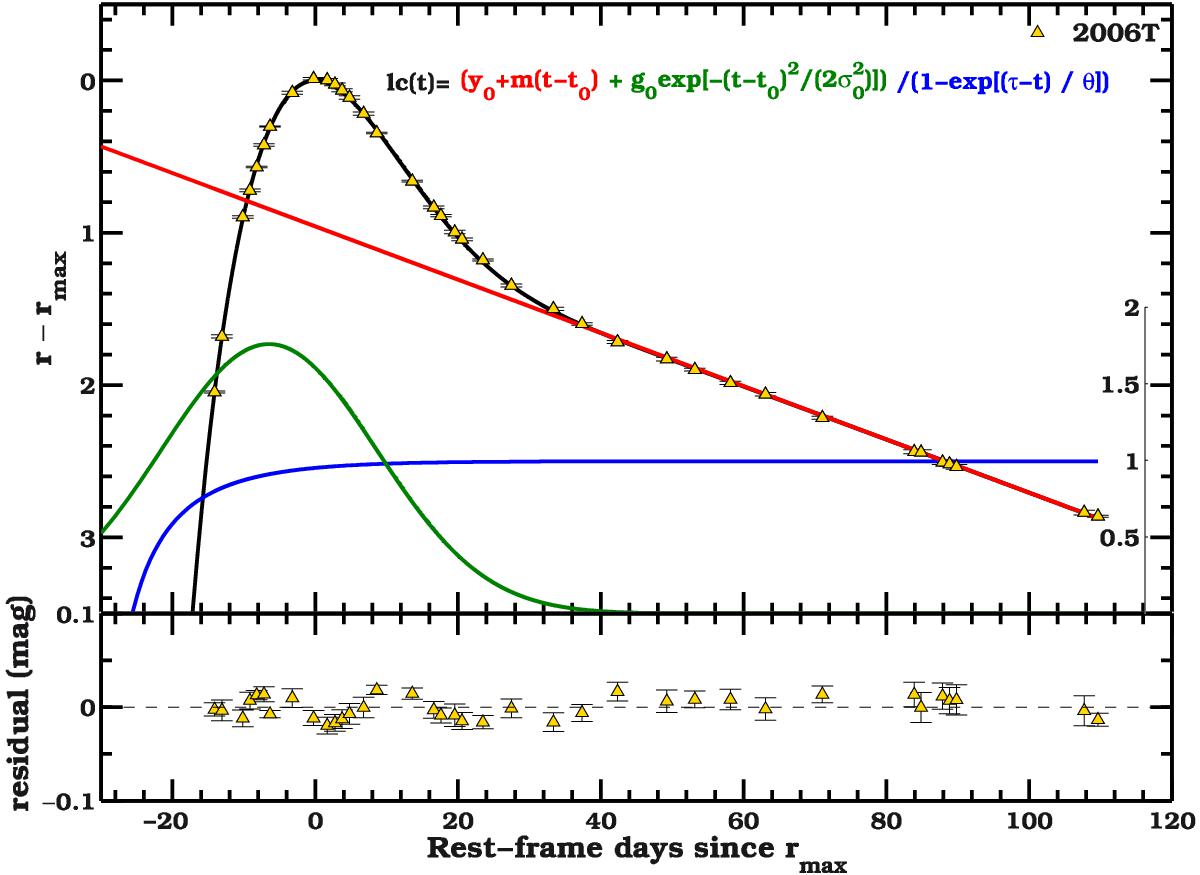
Best fit of Eq. (1)(black solid line) to the r-band light curve (triangles) of SN 2006T normalized to its peak brightness. The three components of the analytic fit are shown: blue for the exponential rise, green for the Gaussian peak, and red for the linear decay. The corresponding terms in Eq. (1)are color-coded accordingly. The residuals between the fit and the photometry are plotted in the bottom panel, and in this case they never exceed 0.03 mag.
Current usage metrics show cumulative count of Article Views (full-text article views including HTML views, PDF and ePub downloads, according to the available data) and Abstracts Views on Vision4Press platform.
Data correspond to usage on the plateform after 2015. The current usage metrics is available 48-96 hours after online publication and is updated daily on week days.
Initial download of the metrics may take a while.