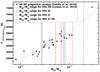
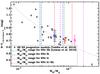
Fig. 8

Left panel: plotted as diamonds is the temperature at +10 d calculated from an extended set of hydrodynamical explosion models that best-fit the bolometric light curves of our sample (see Taddia et al. 2018) vs. the ratio of the 56Ni mass and Mej for each model. The models indicate SE SNe with higher 56Ni to Mej ratios tend to exhibit higher temperatures, and the correlation between these parameters is well described by a power-law fit (black dashed line). Dashed vertical lines indicate the range of the 56Ni mass to Mej ratio inferred by Lyman et al. (2016) based on a large observational sample of SE SNe. The range of the 56Ni mass to Mej ratio for the each SE SN sub-type is relatively narrow, and implies a narrow range of ~1000° in temperature at +10 d. Right panel: inferred B−V color at +10 d determined from hydrodynamical models, plotted versus the ratio between 56Ni mass and Mej. The parameters are fit with a power law function plotted as black dashed line. Dashed vertical lines indicate the range in parameter space inferred by Lyman et al. (2016) for the various SE SN sub-types, while color circles are mean values obtained from the explosion models contained within each of the indicated regions with errorbars corresponding to 1σ uncertainty. This plot indicates a rather narrow range of intrinsic B−V colors are expected for the span of 56Ni to Mej ratios observed in the various SE SN sub-types. B−V color uncertainties are found to be lower than 0.1 mag for each SE SN sub-type.
Current usage metrics show cumulative count of Article Views (full-text article views including HTML views, PDF and ePub downloads, according to the available data) and Abstracts Views on Vision4Press platform.
Data correspond to usage on the plateform after 2015. The current usage metrics is available 48-96 hours after online publication and is updated daily on week days.
Initial download of the metrics may take a while.