Fig. 9
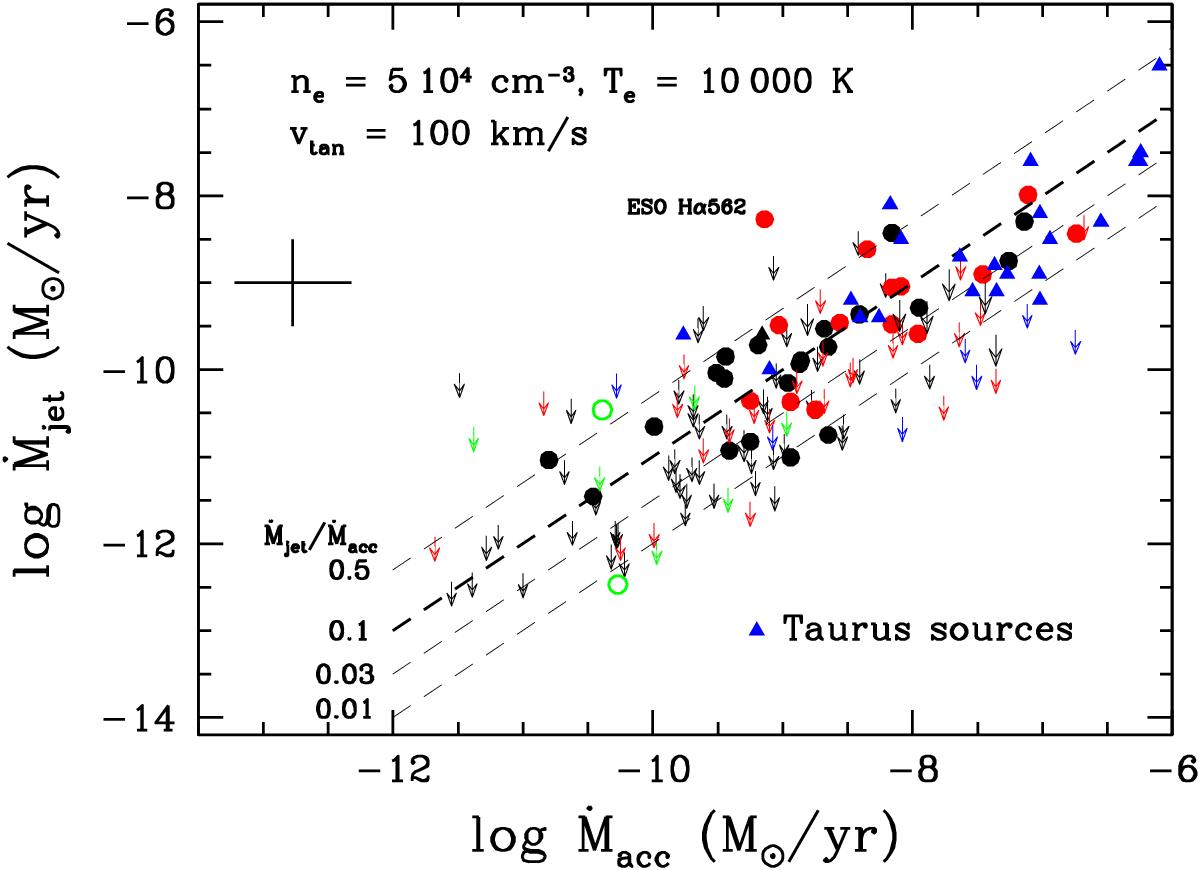
Mass accretion (Ṁacc) vs. mass ejection (Ṁjet) rates. The mass ejection has been measured from the [O i]6300 Å luminosity assuming a jet tangential velocity of 100 km s-1 and gas temperature and density of 10 000 K and 5 × 104 cm-3 respectively. Black, red and green symbols are as in Fig. 4, while blue triangles indicate the values for the sample of Taurus sources of H95. Updated mass accretion rates from these sources are estimated from the data in Rigliaco et al. (2013). Average data point uncertainty is indicated with a cross on the left side of the plot. Arrows refer to upper limits on Ṁjet derived from the 3σ upper limits on the L[O i] HVC luminosity.
Current usage metrics show cumulative count of Article Views (full-text article views including HTML views, PDF and ePub downloads, according to the available data) and Abstracts Views on Vision4Press platform.
Data correspond to usage on the plateform after 2015. The current usage metrics is available 48-96 hours after online publication and is updated daily on week days.
Initial download of the metrics may take a while.