Fig. 4
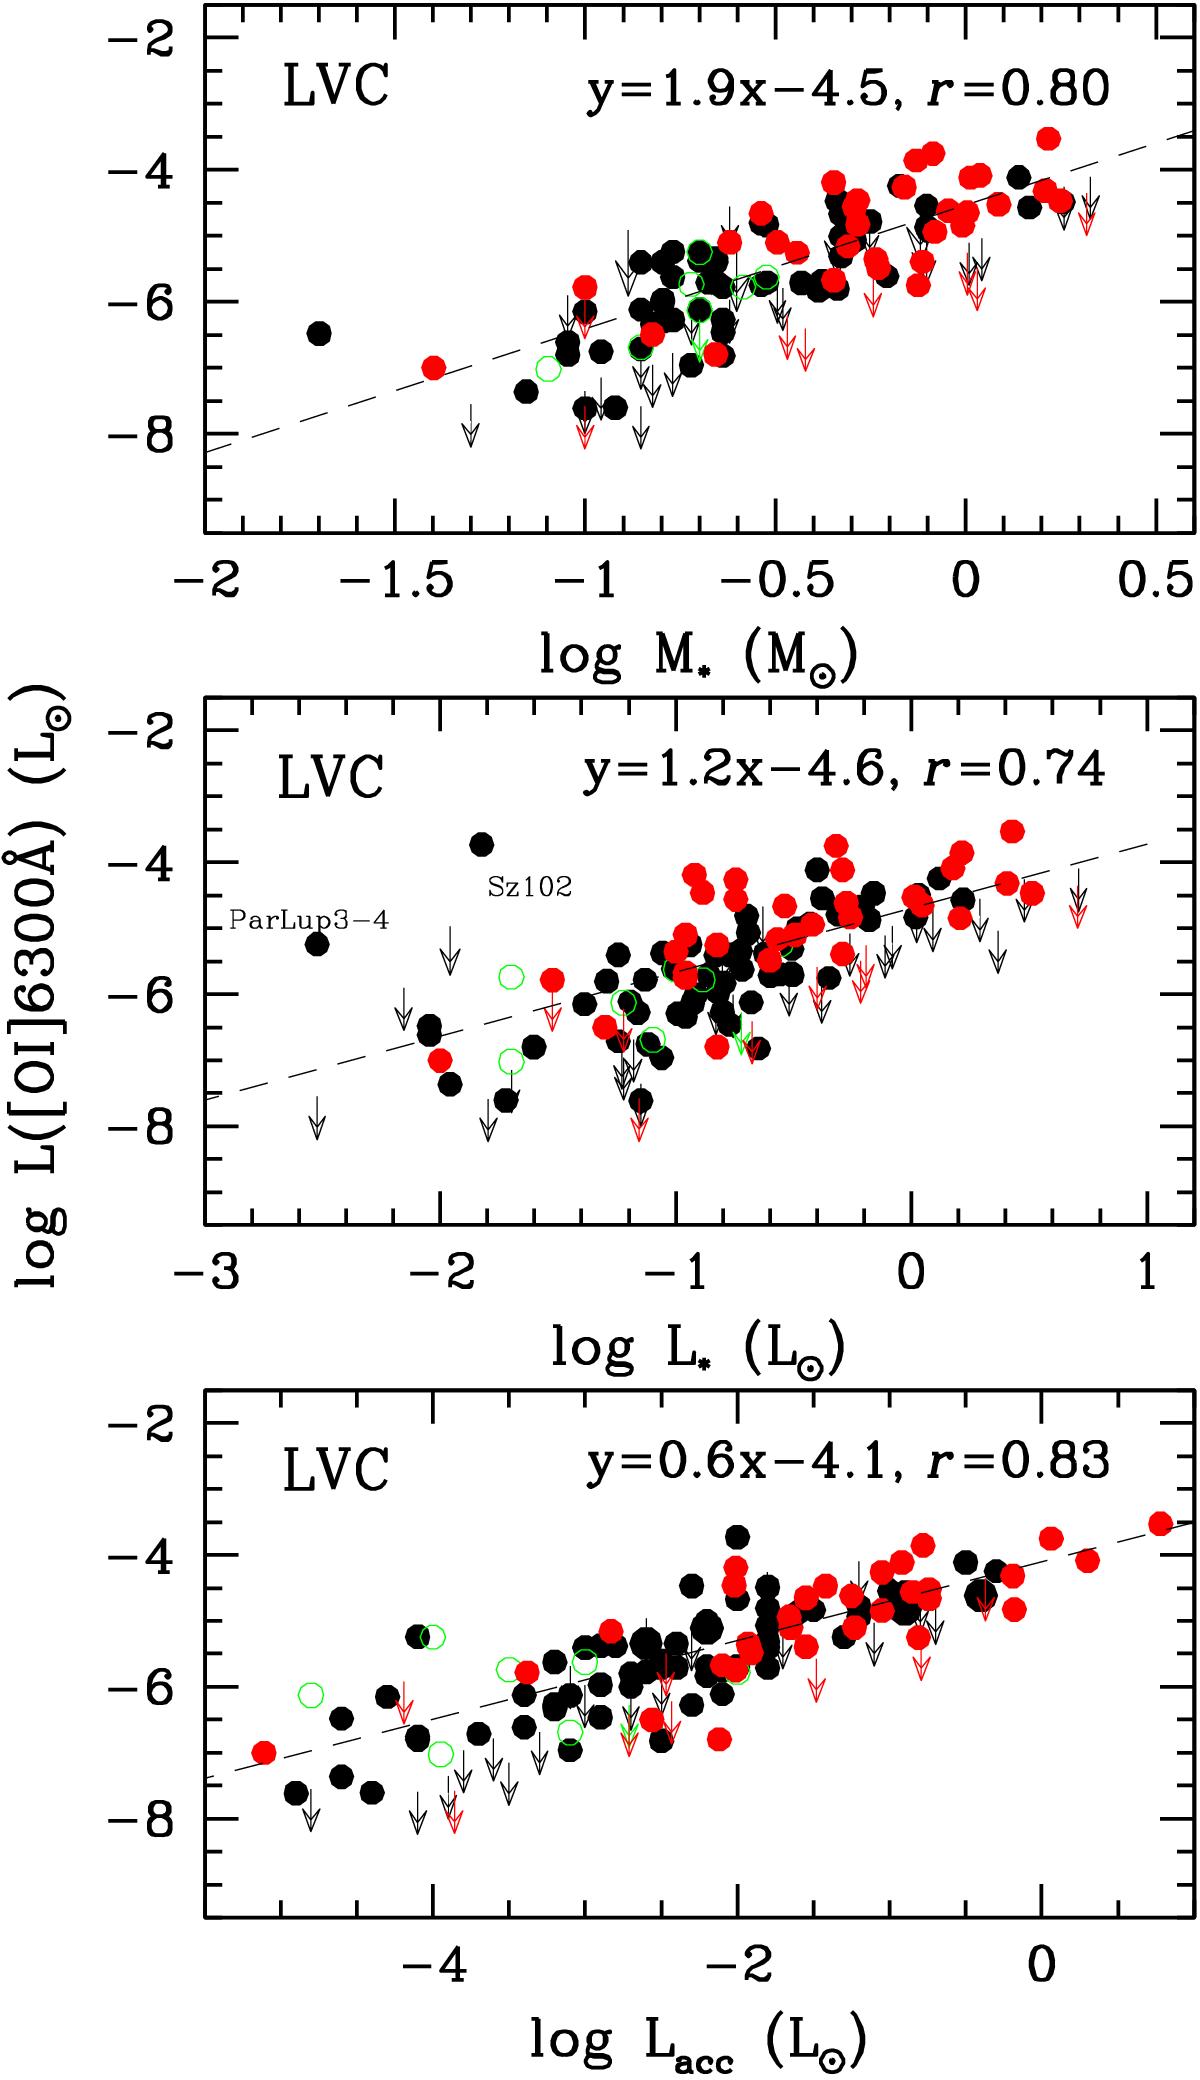
[O i]6300 Å line luminosity of the LVC is plotted as a function of, from top to bottom, stellar mass, stellar luminosity and accretion luminosity. Colour codes for the symbols are as in Fig. 3. Arrows refer to 3σ upper limits. The dashed line indicates the linear regression whose parameters are given in the upper right corner of each figure, together with the correlation parameter.
Current usage metrics show cumulative count of Article Views (full-text article views including HTML views, PDF and ePub downloads, according to the available data) and Abstracts Views on Vision4Press platform.
Data correspond to usage on the plateform after 2015. The current usage metrics is available 48-96 hours after online publication and is updated daily on week days.
Initial download of the metrics may take a while.