Fig. 2
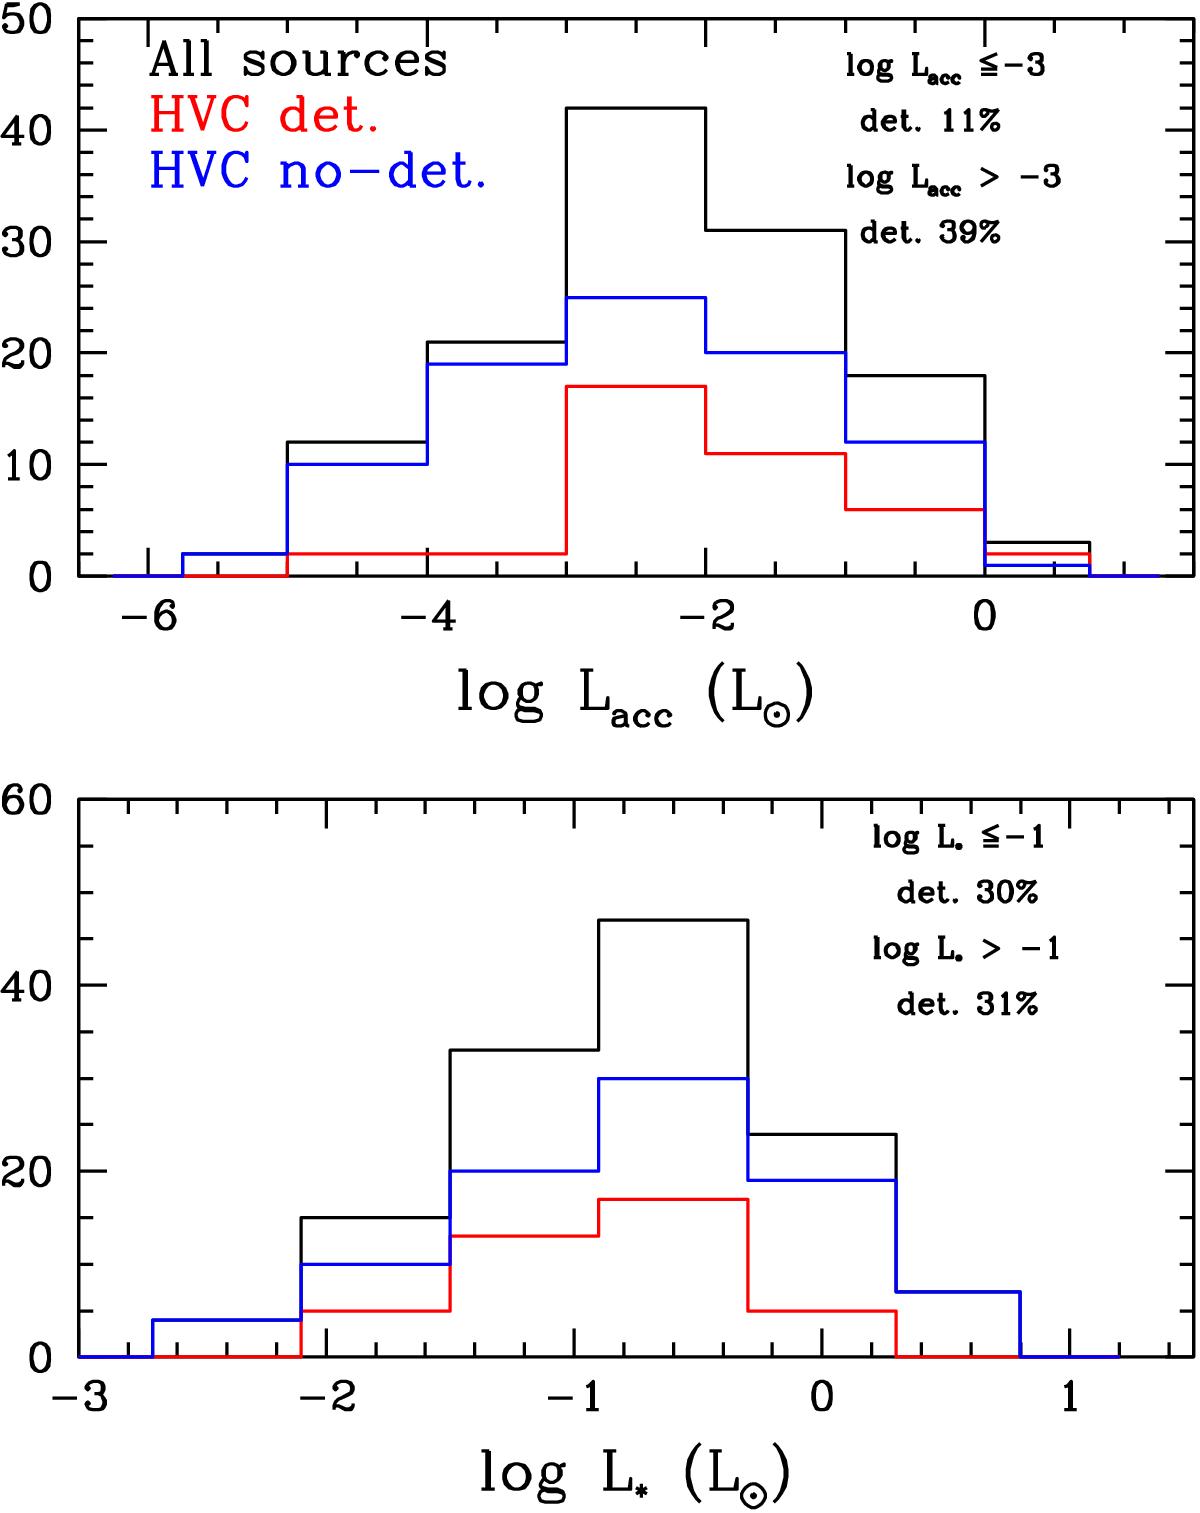
Distribution of accretion (top) and stellar (bottom) luminosity for all the sources of our sample is depicted in black. Red and blue histograms are relative to sources where the HVC has been detected and not-detected respectively. In the upper corner of each plot the percentage of HVC detection in two ranges of luminosities is indicated.
Current usage metrics show cumulative count of Article Views (full-text article views including HTML views, PDF and ePub downloads, according to the available data) and Abstracts Views on Vision4Press platform.
Data correspond to usage on the plateform after 2015. The current usage metrics is available 48-96 hours after online publication and is updated daily on week days.
Initial download of the metrics may take a while.