Fig. D.1
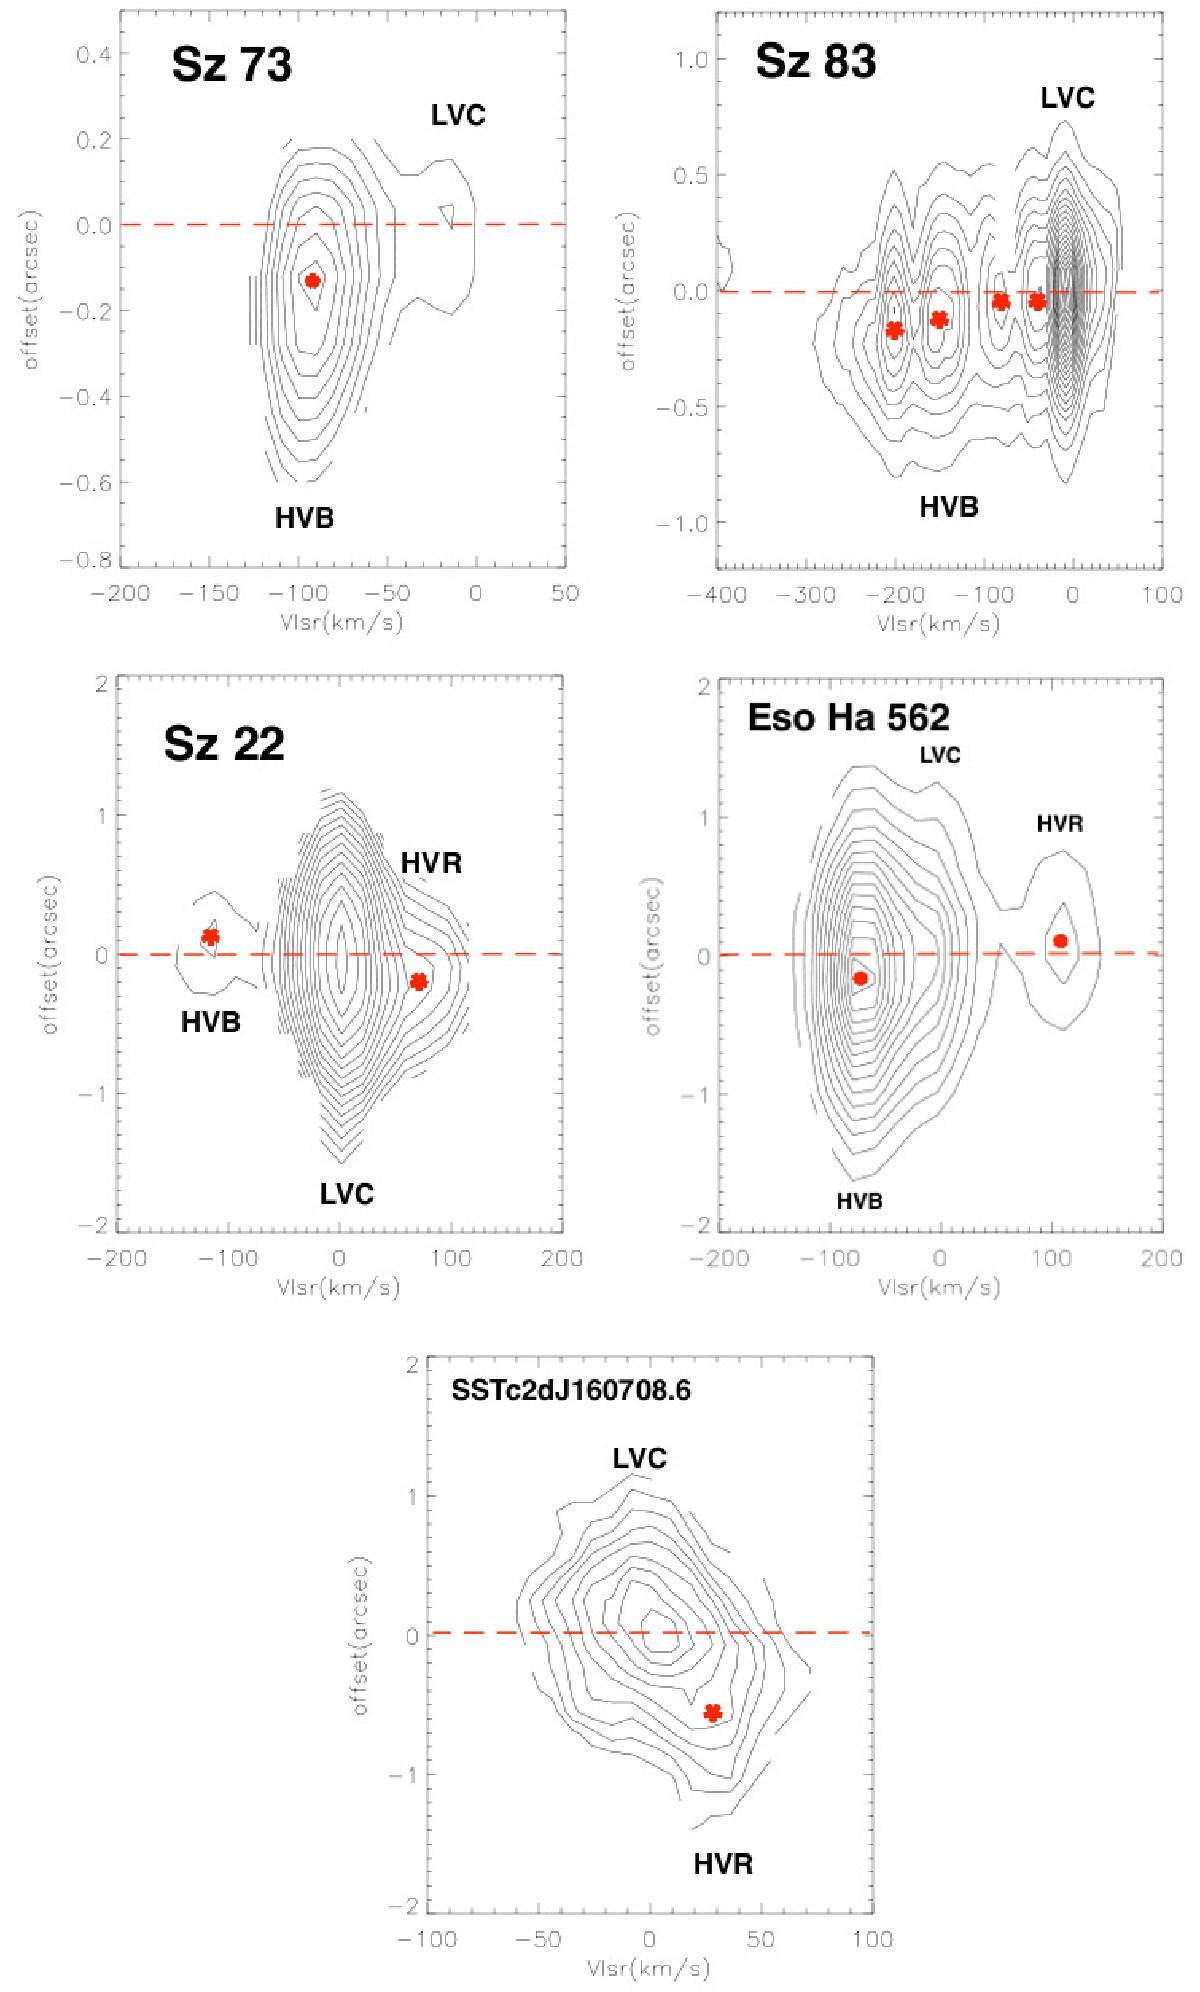
[O i]6300 Å continuum subtracted position velocity (PV) diagrams of five sources exhibiting strong HVC. The straight line indicates the position of the continuum while red dots highlight the peaks of the blue- and red-shifted HVC (i.e. HVB and HVR, respectively) and of the LVC. The HVC peaks are systematically shifted with respect to the continuum position, showing that this component is extended.
Current usage metrics show cumulative count of Article Views (full-text article views including HTML views, PDF and ePub downloads, according to the available data) and Abstracts Views on Vision4Press platform.
Data correspond to usage on the plateform after 2015. The current usage metrics is available 48-96 hours after online publication and is updated daily on week days.
Initial download of the metrics may take a while.