Fig. 11
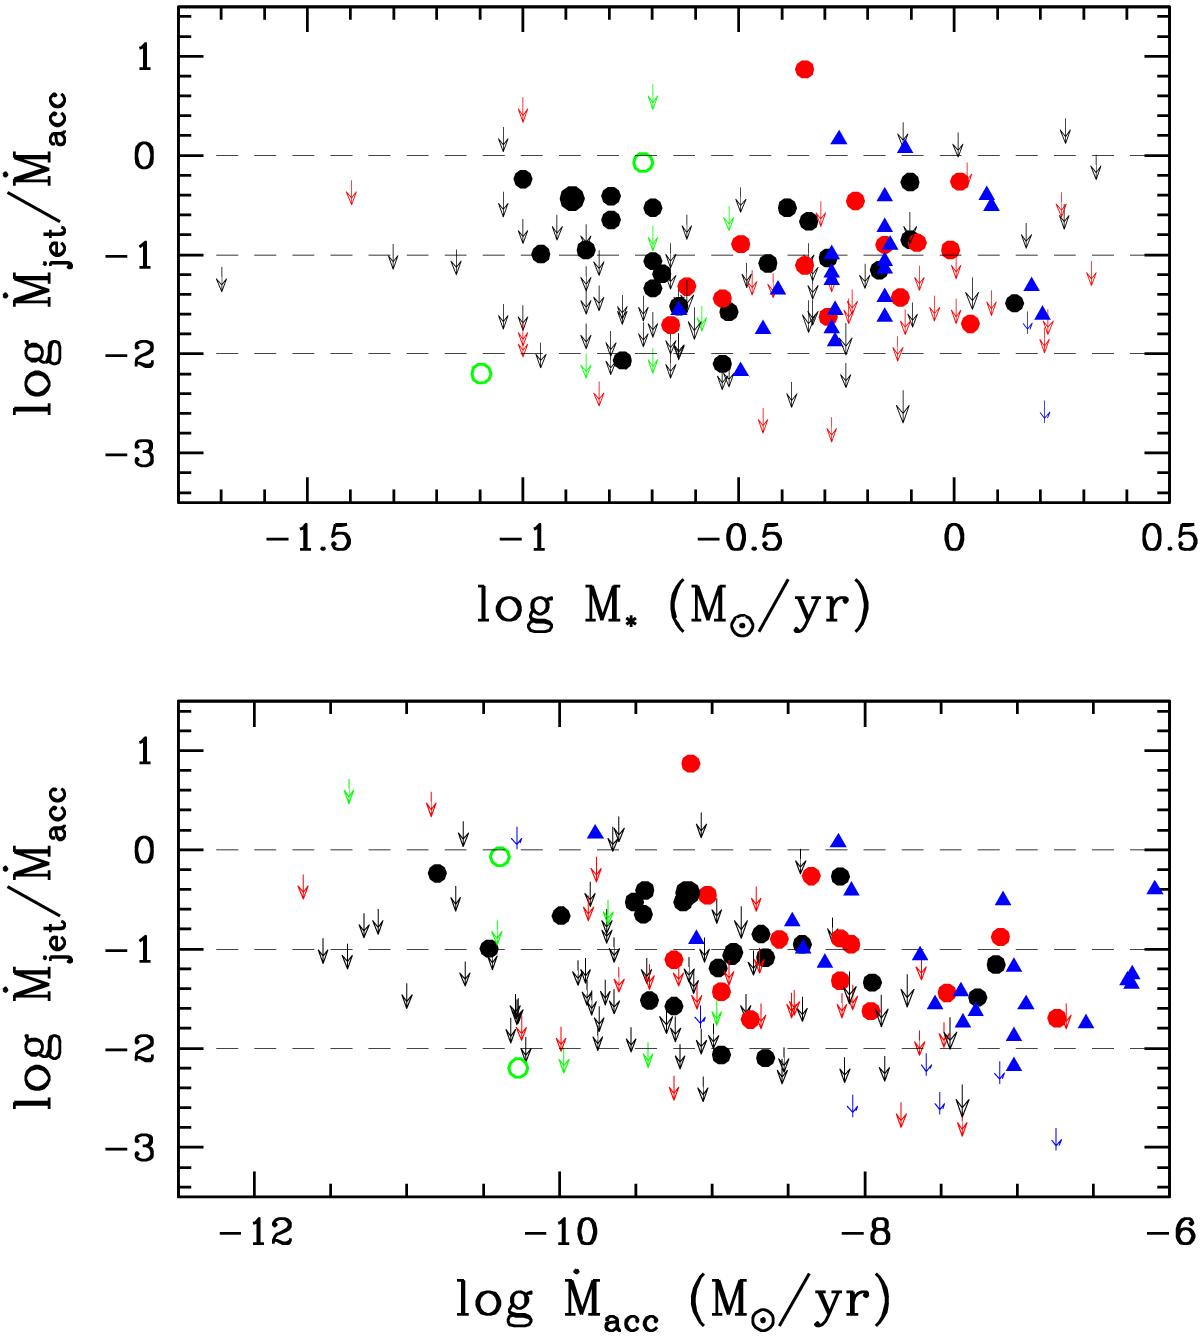
Upper panel: log of the Ṁjet/Ṁacc ratio plotted as a function of the log of the stellar mass. The three horizontal dashed lines correspond to Ṁjet/Ṁacc = 1, 0.1 and 0.01. Black, red and green symbols are as in Fig. 4 while blue triangles refer to the sources in Taurus (see caption of Fig. 9). Lower panel: log of the Ṁjet/Ṁacc ratio plotted as a function of the log of the mass accretion rates.
Current usage metrics show cumulative count of Article Views (full-text article views including HTML views, PDF and ePub downloads, according to the available data) and Abstracts Views on Vision4Press platform.
Data correspond to usage on the plateform after 2015. The current usage metrics is available 48-96 hours after online publication and is updated daily on week days.
Initial download of the metrics may take a while.