Fig. 6
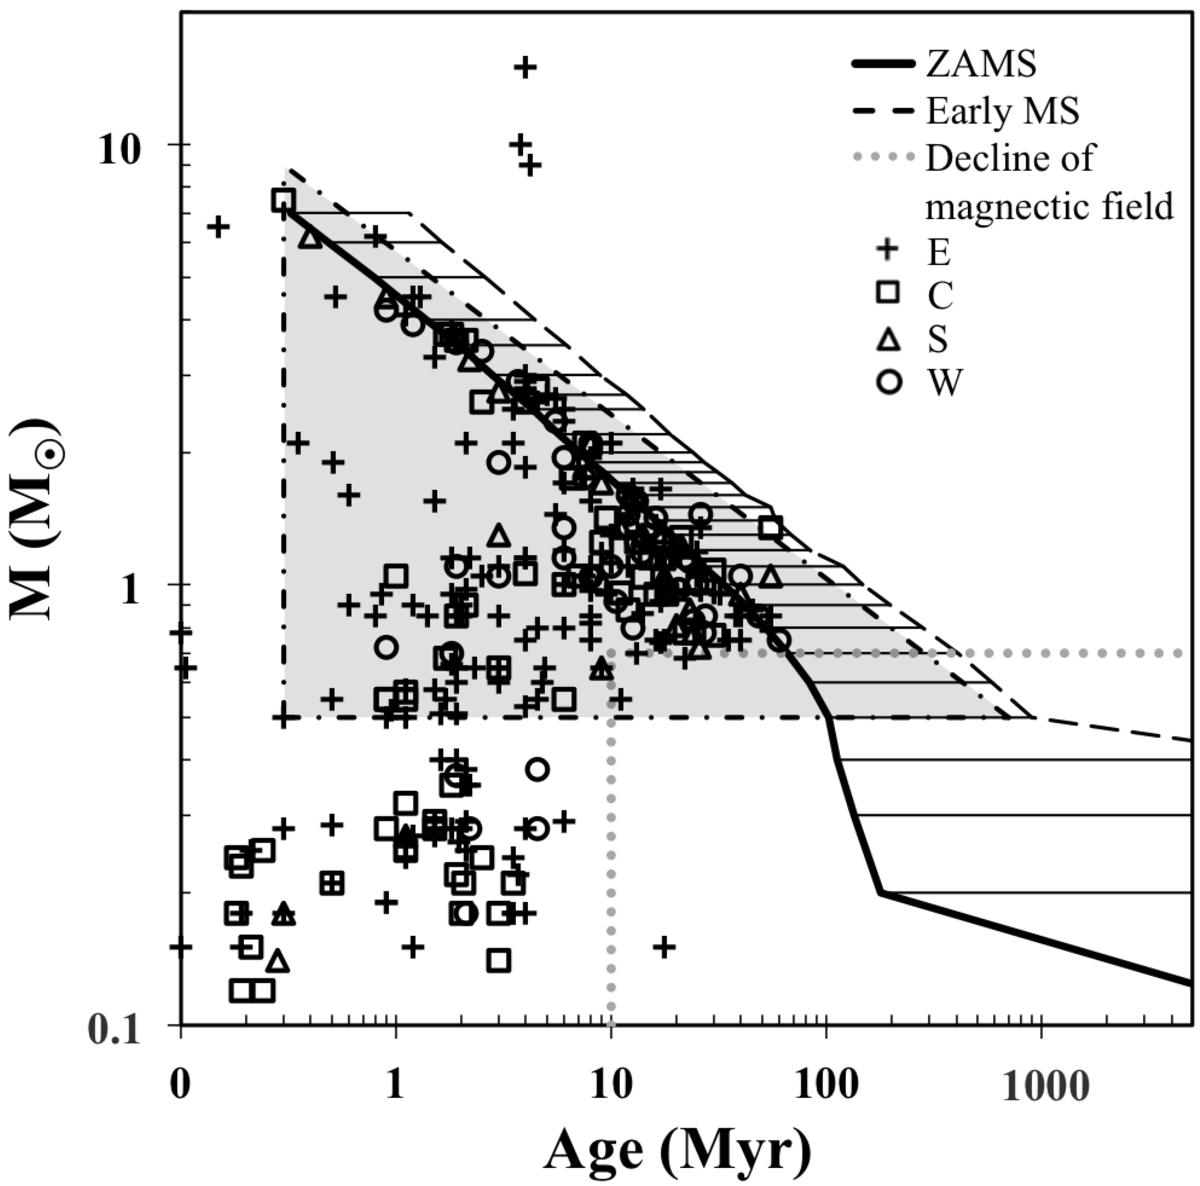
“Best sample” of X-ray sources based on estimates of masses and ages for 340 2MASS counterparts (see Table B.2). This sample, which takes into account the incompleteness of our sample below ~0.5 M⊙, are present in the grey area. The empty area between dotted lines corresponding to the mass range 0.5–0.7 M⊙ and age >10 Myr is interpreted as the decline of magnetic activity of low-mass young stars with age (see Sect. 7.2).
Current usage metrics show cumulative count of Article Views (full-text article views including HTML views, PDF and ePub downloads, according to the available data) and Abstracts Views on Vision4Press platform.
Data correspond to usage on the plateform after 2015. The current usage metrics is available 48-96 hours after online publication and is updated daily on week days.
Initial download of the metrics may take a while.