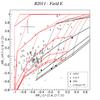
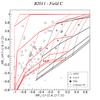
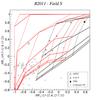
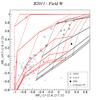
Fig. A.1
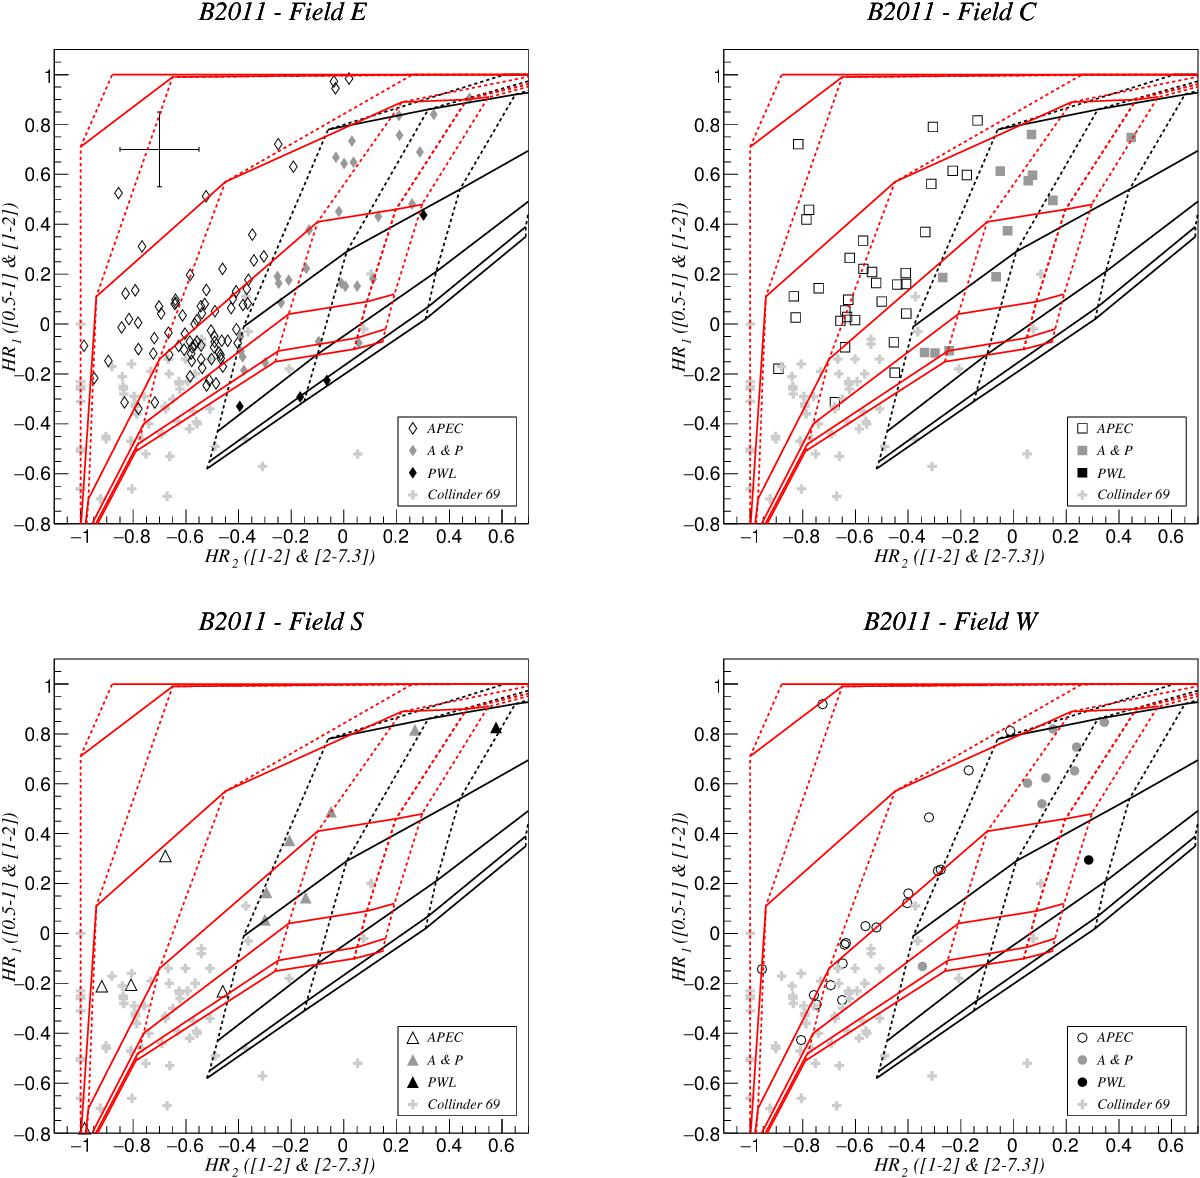
Hardness ratio diagrams in 0.5–7.3 keV energy band, defined by Barrado et al. (2011), comparing our sample with the stars of the young Collinder 69 cluster (grey crosses). For illustration, error bars corresponding to 0.15, which is the mean error found in the HR estimates of our sample, are plotted in the first panel. Top panels present the sources from fields E (diamonds) and C (squares), while S (triangles) and W (circles) are shown in the bottom. Grids from the APEC model are shown in red, using dotted lines for 6.0 < log T< 8.5 (increasing from left to right, in steps of 0.5). Power-law grid with γ = 0, 1, 2 is shown by black dotted lines (increasing from left to right). Both grids use full lines to represent 20 < log NH< 23, increasing in steps of 0.5, from bottom to top.
Current usage metrics show cumulative count of Article Views (full-text article views including HTML views, PDF and ePub downloads, according to the available data) and Abstracts Views on Vision4Press platform.
Data correspond to usage on the plateform after 2015. The current usage metrics is available 48-96 hours after online publication and is updated daily on week days.
Initial download of the metrics may take a while.


