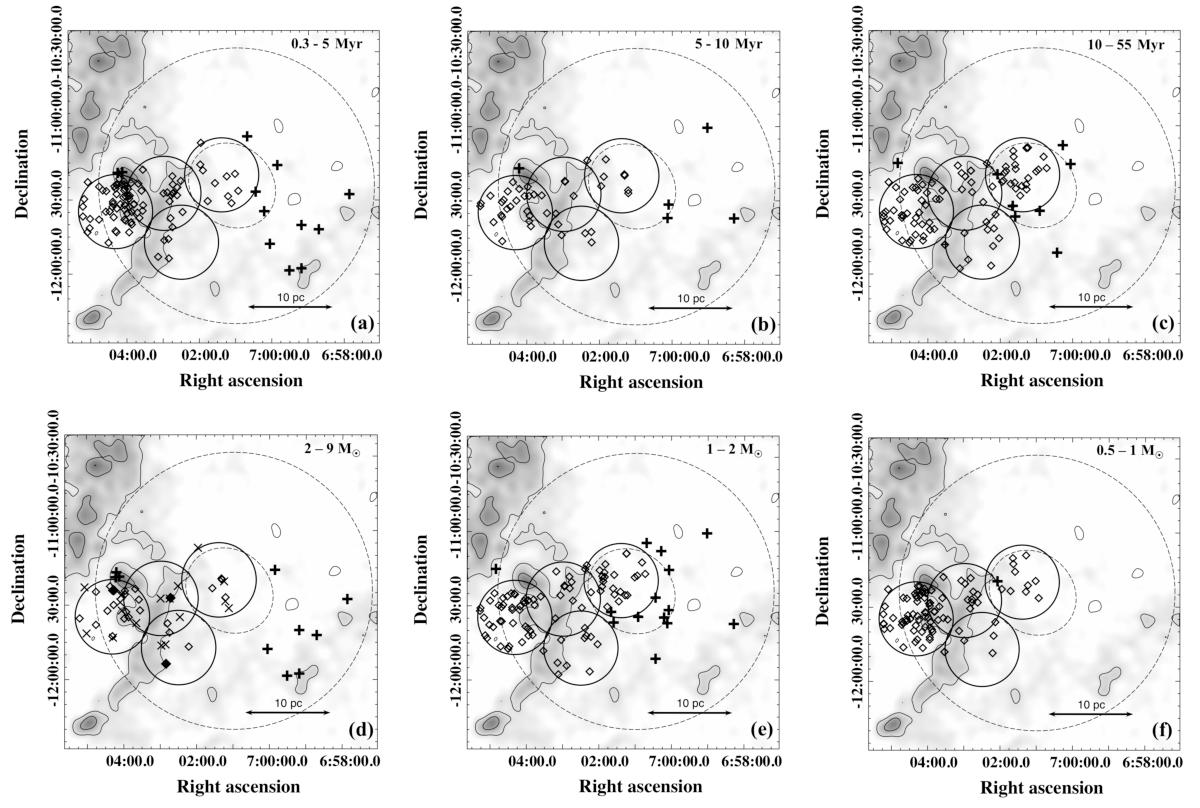
Fig. 12

Spatial distribution of NIR counterparts compared with the visual extinction map9. The lowest contours indicate a separation of dense regions (AV> 2). The diamonds and crosses represent XMM-Newton and ROSAT sources, respectively. Top panels a–c show objects with less than 5 Myr, 5 to 10 Myr, and more than 10 Myr, respectively. Bottom panels d–f are objects with masses larger than 2 M⊙, 1 to 2 M⊙ and between 0.5 to 1 M⊙, in this panel are highlighted XMM-Newton objects with masses between 2 and 3 M⊙ (diamonds), 3 and 5 M⊙ (X), and more than 5 M⊙ (full diamonds). Black full lines delimit the fields E, C, S, and W and the ROSAT field is indicated by a dashed line.
Current usage metrics show cumulative count of Article Views (full-text article views including HTML views, PDF and ePub downloads, according to the available data) and Abstracts Views on Vision4Press platform.
Data correspond to usage on the plateform after 2015. The current usage metrics is available 48-96 hours after online publication and is updated daily on week days.
Initial download of the metrics may take a while.


