Fig. 11
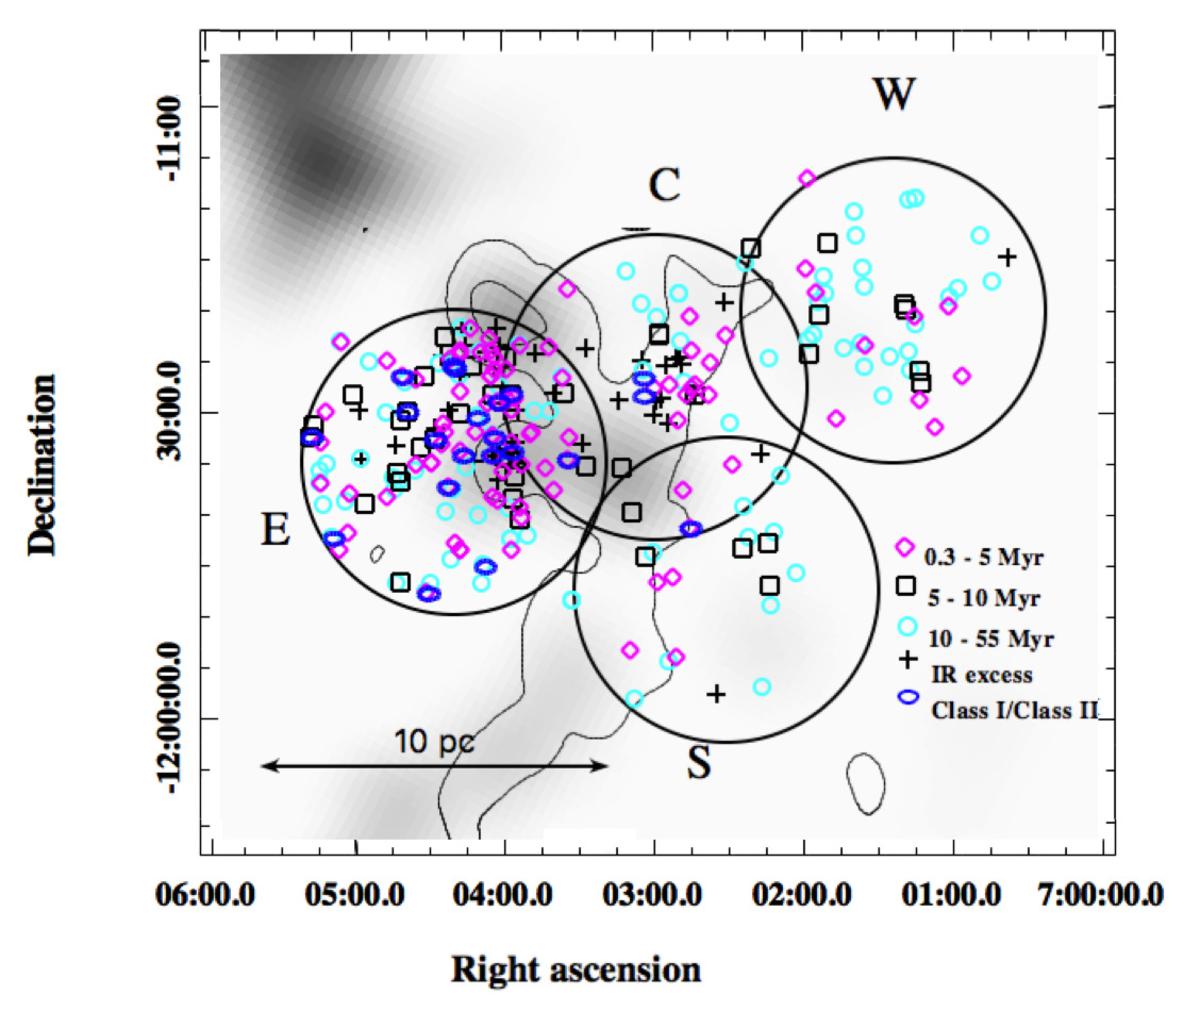
Spatial distribution of NIR counterpart of X-ray sources as a function of age. This is compared to a 13CO map10 shown by the grey image superimposed on AV> 2 and 4 mag contours (the same as Fig. 1). The diamonds, squares, and circles represent objects with less than 5 Myr, between 5 and 10 Myr, and more than 10 Myr, respectively. The counterparts found outside of Siess et al. (2000) PMS isochrones are represented by crosses and disk-bearing candidates (see Sect. 4.1) are shown by blue ellipses. Black circles delimit the fields E, C, S, and W.
Current usage metrics show cumulative count of Article Views (full-text article views including HTML views, PDF and ePub downloads, according to the available data) and Abstracts Views on Vision4Press platform.
Data correspond to usage on the plateform after 2015. The current usage metrics is available 48-96 hours after online publication and is updated daily on week days.
Initial download of the metrics may take a while.