Free Access
Fig. 6
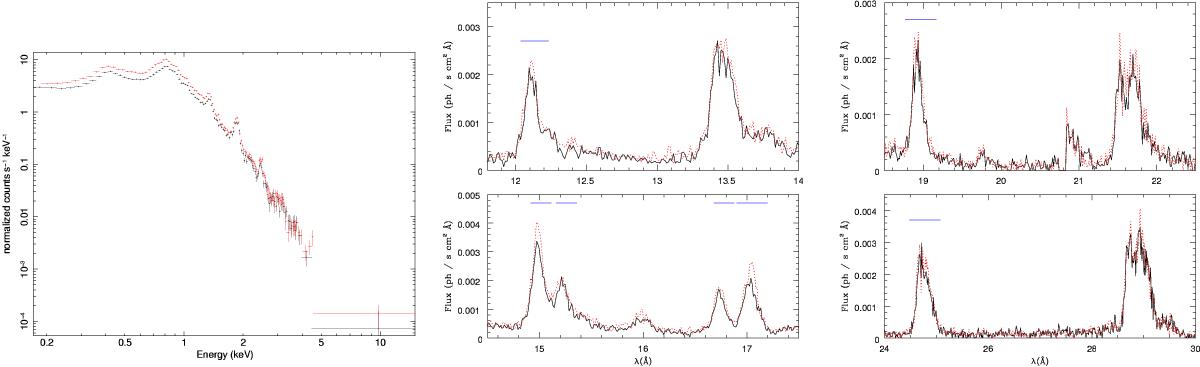
Comparison of the pn (left) and RGS (middle and right) spectra observed at minimum brightness (first part of Rev. 1814; solid black line) and maximum brightness (first part of Rev. 2183; dotted red line). Blue segments above lines of RGS spectra indicate the intervals chosen for the moment calculations.
This figure is made of several images, please see below:
Current usage metrics show cumulative count of Article Views (full-text article views including HTML views, PDF and ePub downloads, according to the available data) and Abstracts Views on Vision4Press platform.
Data correspond to usage on the plateform after 2015. The current usage metrics is available 48-96 hours after online publication and is updated daily on week days.
Initial download of the metrics may take a while.