Fig. B.1
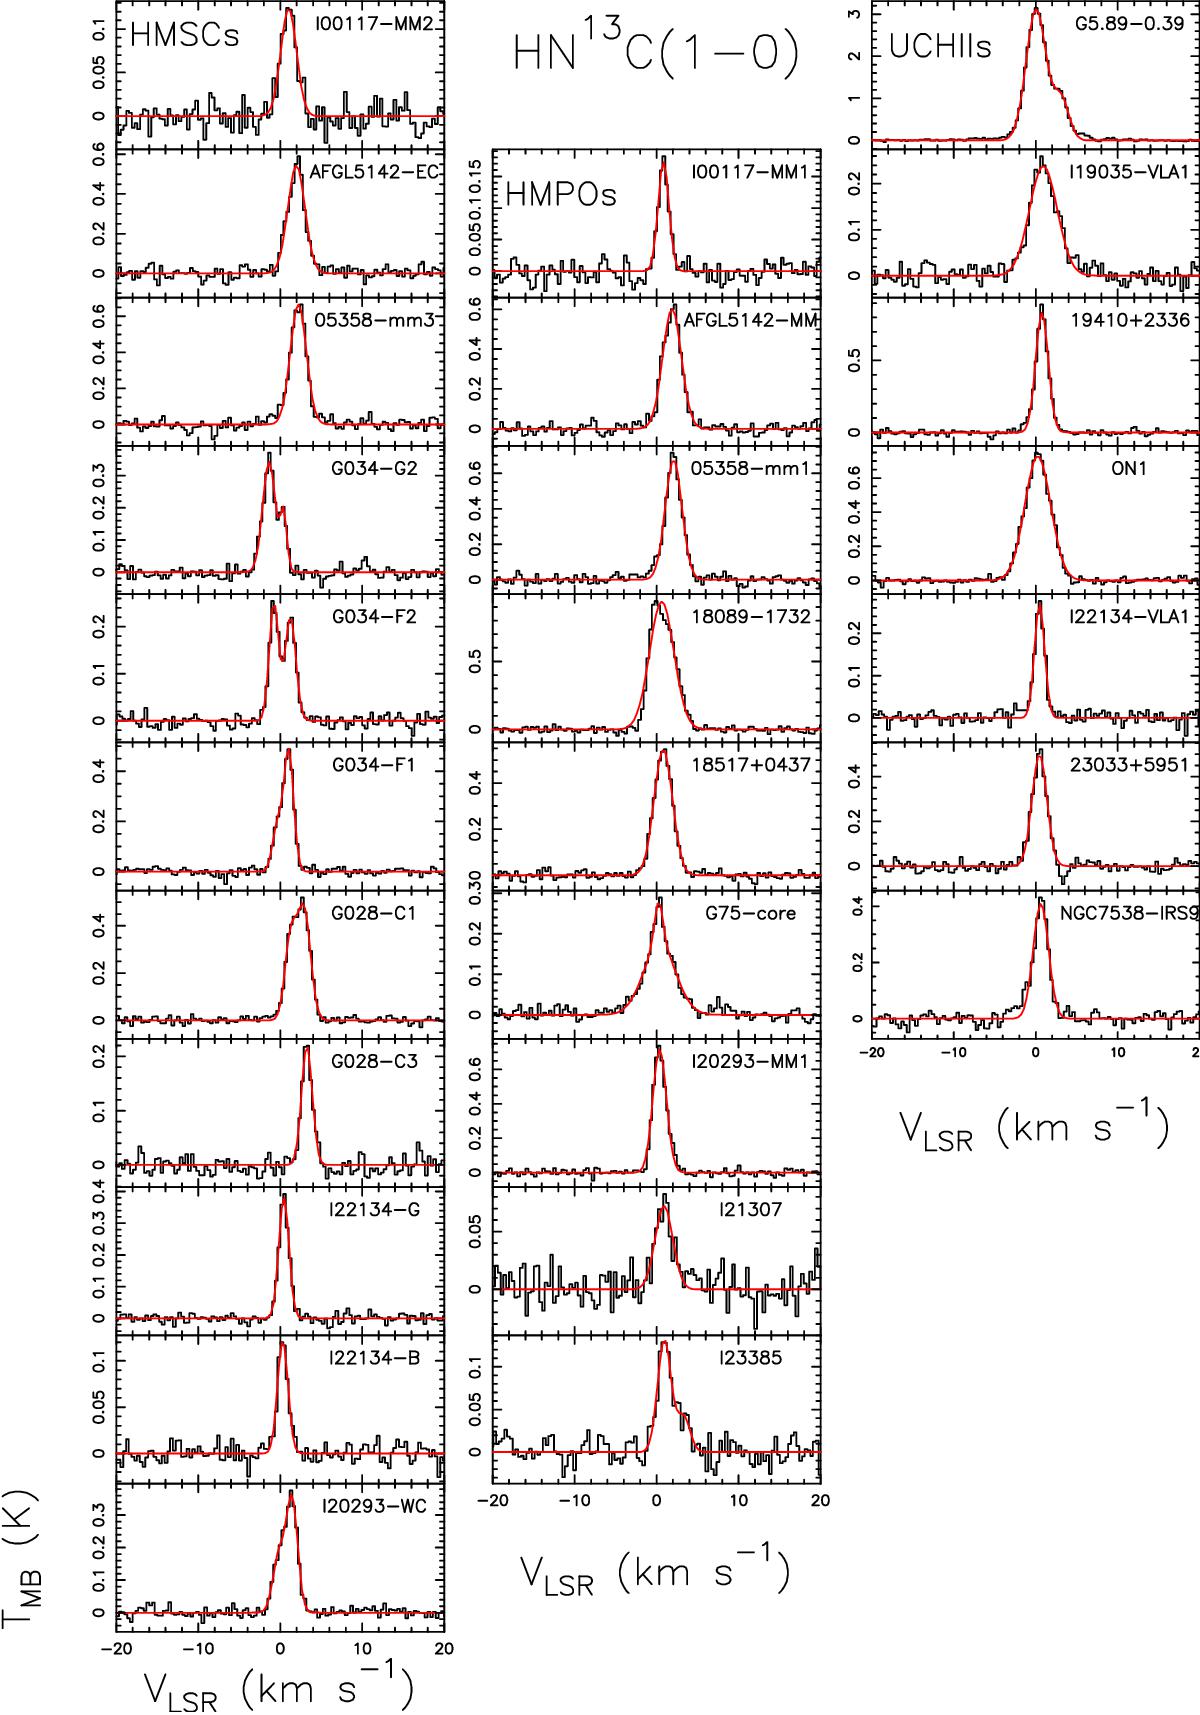
Spectra of HN13C(1–0) obtained for the sources classified as HMSCs (first column), HMPOs (second column), and UC HII regions (third column). For each spectrum the x-axis represents a velocity interval of ± 20 km s-1 around the systemic velocity listed in Table 1 of Fontani et al. (2015b). The y-axis shows the intensity in main-beam temperature units. The red curves are the best Gaussian fits obtained with CLASS. For some sources (I20293-WC, G034-G2, G034-F2, G5.89-0.39, G034-F1, G028-C1, and I23385), we have observed two components: we have fitted both lines and used only the line centered on the systemic velocity of the source to compute the column densities.
Current usage metrics show cumulative count of Article Views (full-text article views including HTML views, PDF and ePub downloads, according to the available data) and Abstracts Views on Vision4Press platform.
Data correspond to usage on the plateform after 2015. The current usage metrics is available 48-96 hours after online publication and is updated daily on week days.
Initial download of the metrics may take a while.