Fig. 1
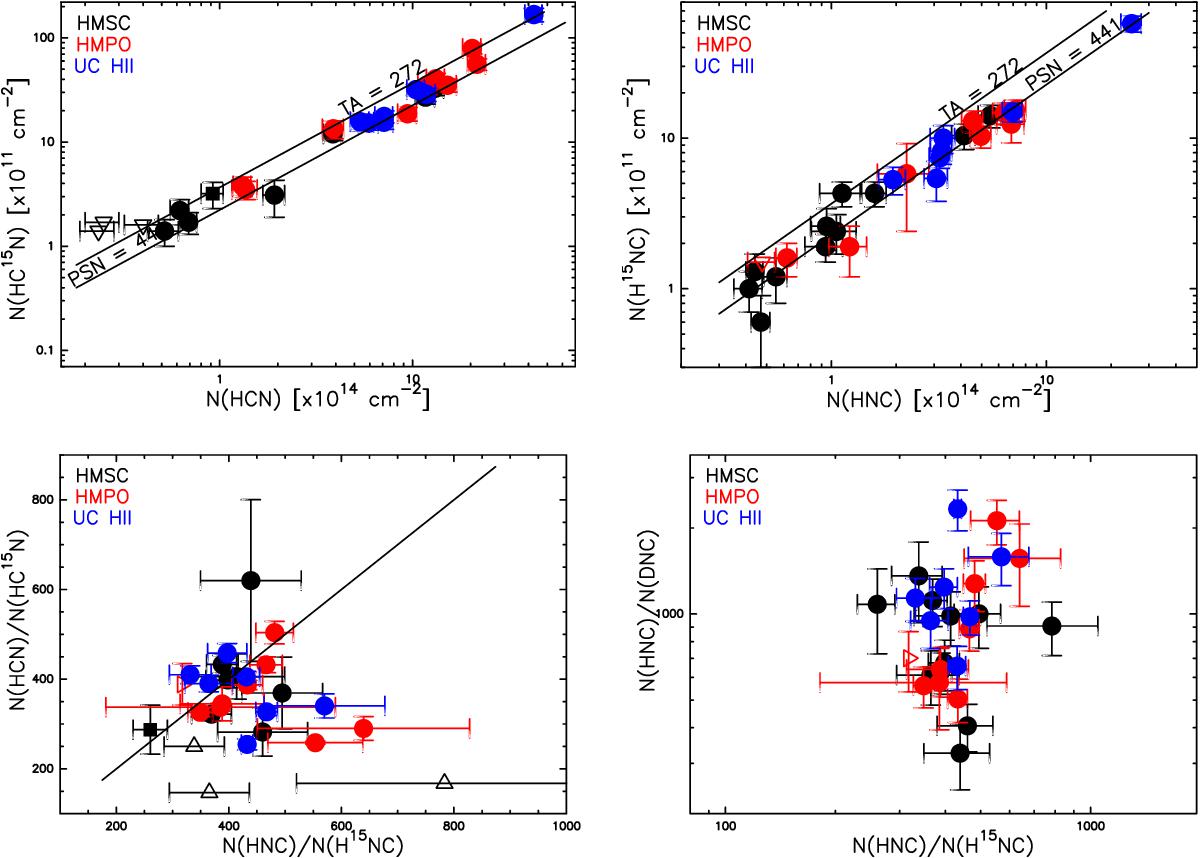
Top panels: column density of HCN compared with that of HC15N (left) and of HNC compared with that of H15NC (right). Bottom panels: comparison between the 14N/15N isotopic ratios derived from the column density ratios N(HCN)/N(HC15N) and N(HNC)/N(H15NC) (left) and comparison between the H/D and 14N/15N isotopic ratios in HNC (right). In all panels, the filled circles represent the detected sources (black = HMSCs; red = HMPOs; blue = UC HIIs). The open triangles in the top panels are the upper limits on N(H15NC) (right) and N(HC15N) (left), while in the bottom panels the open triangles indicate lower limits on either N(HCN)/N(HC15N) or N(HNC)/N(H15NC). The filled squares represent tentative detections. The solid lines in the top panels indicate the mean atomic composition as measured in the terrestrial atmosphere (TA) and in the protosolar nebula (PSN), while in the bottom left panel, the solid line indicates the locus of points where N(HCN)/N(HC15N) is equal to N(HNC)/N(H15NC).
Current usage metrics show cumulative count of Article Views (full-text article views including HTML views, PDF and ePub downloads, according to the available data) and Abstracts Views on Vision4Press platform.
Data correspond to usage on the plateform after 2015. The current usage metrics is available 48-96 hours after online publication and is updated daily on week days.
Initial download of the metrics may take a while.