Fig. 9
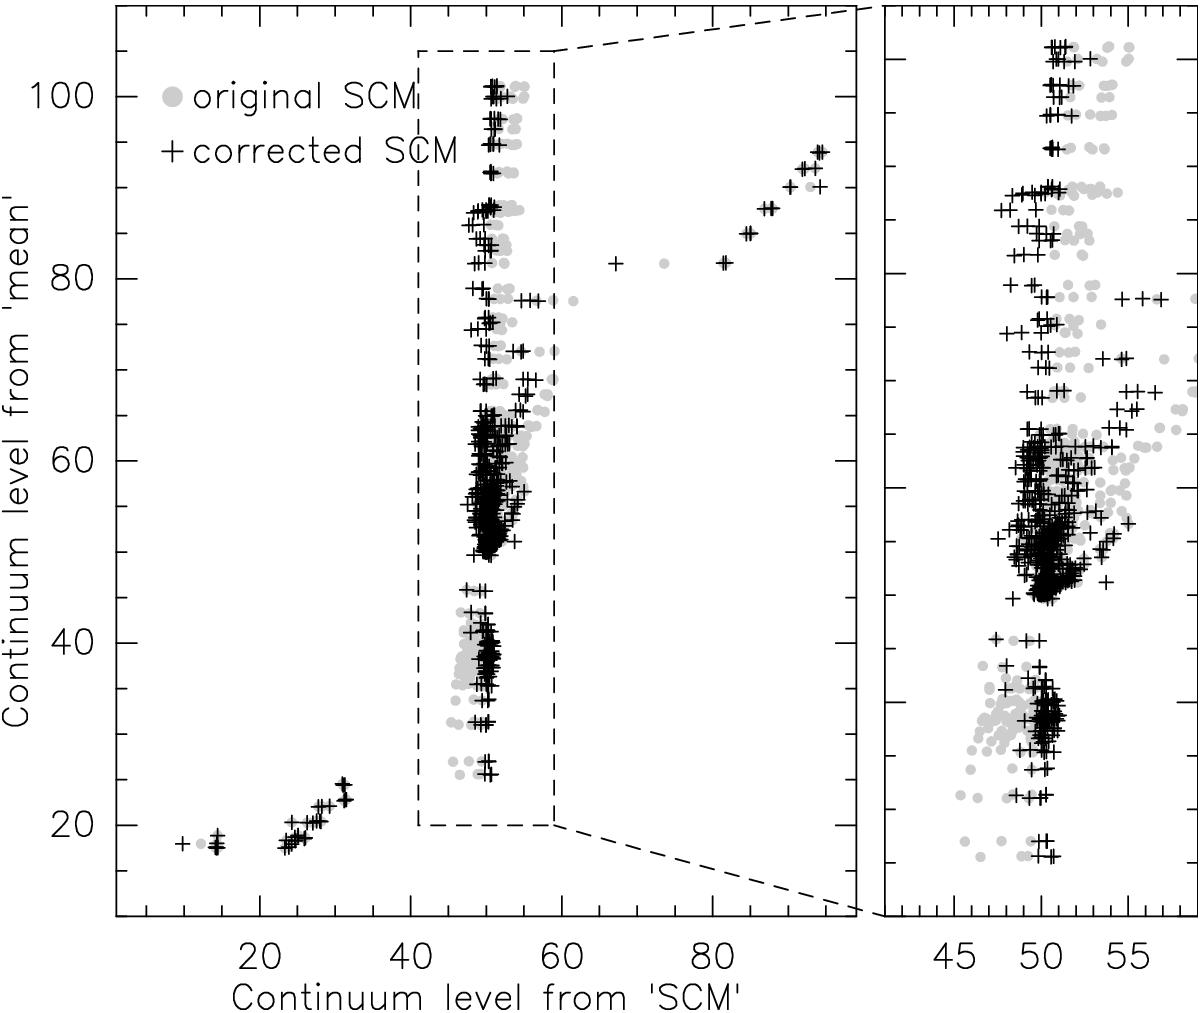
Comparison of the continuum level determined with the original sigma-clipping method (gray dots) and the corrected version (black crosses). In order to better show the differences between the two methods, the y-axis has been selected to show the continuum level determined with the mean. The right panel shows a zoom in of the central region. The black crosses appear clustered closer to the real continuum level, 50 K, compared to the gray dots.
Current usage metrics show cumulative count of Article Views (full-text article views including HTML views, PDF and ePub downloads, according to the available data) and Abstracts Views on Vision4Press platform.
Data correspond to usage on the plateform after 2015. The current usage metrics is available 48-96 hours after online publication and is updated daily on week days.
Initial download of the metrics may take a while.