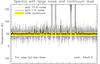
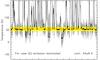
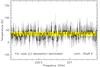
Fig. 8

Synthetic spectra for the three cases considered in Sect. 2.3 corresponding to (top) few-lines spectrum, (middle) emission-dominated spectrum, and (bottom) absorption-dominated spectrum. The gray lines show the spectra with a 15 K noise, while the black lines show the spectra with 11 K noise. The red line together with the shaded yellow area correspond to the continuum level (plus noise) as determined with the sigma-clipping method.
Current usage metrics show cumulative count of Article Views (full-text article views including HTML views, PDF and ePub downloads, according to the available data) and Abstracts Views on Vision4Press platform.
Data correspond to usage on the plateform after 2015. The current usage metrics is available 48-96 hours after online publication and is updated daily on week days.
Initial download of the metrics may take a while.