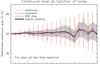
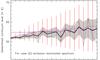
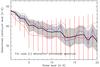
Fig. 7

Variation of the continuum emission level as a function of the noise artificially introduced in the synthetic spectra. The dotted line shows the continuum as the maximum of the histogram, the Gaussian continuum level together with its uncertainty are shown with red lines, the KDE maximum continuum level determination is shown in blue, and the sigma-clipping continuum level is shown as a thick black line with its uncertainty depicted as a gray area. The different panels correspond to (top) few-lines spectrum, (middle) emission-dominated spectrum and (bottom) absorption-dominated spectrum.
Current usage metrics show cumulative count of Article Views (full-text article views including HTML views, PDF and ePub downloads, according to the available data) and Abstracts Views on Vision4Press platform.
Data correspond to usage on the plateform after 2015. The current usage metrics is available 48-96 hours after online publication and is updated daily on week days.
Initial download of the metrics may take a while.