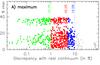
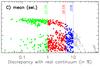
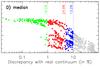
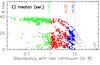
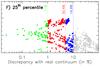
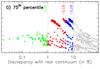
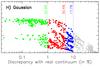
Fig. 5

Scatter plots of the percentage of channels with intensity in the range [continuum−noise,continuum + noise] against the discrepancy between the determined continuum level and the real one (in percentage). The different panels correspond to the different methods described in Sect. 2.1, as in Fig. 4. In each panel, green dots correspond to synthetic spectra for which the continuum level has a discrepancy <1%, red dots are those spectra with discrepancies in the range 1–5%, blue dots are those spectra with discrepancies 5–10%, and gray dots have discrepancies >10%. The success rate (or percentage of spectra with a given discrepancy) are indicated next to the vertical, colored lines (see also Table 2).

Current usage metrics show cumulative count of Article Views (full-text article views including HTML views, PDF and ePub downloads, according to the available data) and Abstracts Views on Vision4Press platform.
Data correspond to usage on the plateform after 2015. The current usage metrics is available 48-96 hours after online publication and is updated daily on week days.
Initial download of the metrics may take a while.