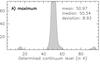
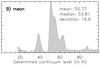
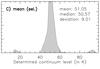
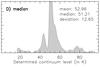
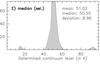
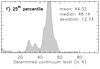
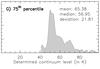
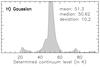
Fig. 4

Distribution of the continuum levels for 750 different synthetic spectra (see Sect. 2.2) determined with the methods: (A) maximum, (B) mean, (C) mean considering the bins around the maximum of the spectral histogram, (D) median, (E) median of the selected bins, (F) the 25th percentile, (G) the 75th percentile, (H) Gaussian fit, (I) Gaussian fit to the selected bins, (J) the maximum of the KDE, (K) the sigma-clipping method, and (L) the corrected version of the sigma-clipping method as introduced in Sect. 2.4. For each panel, we indicate in the top-right corner the mean, median and standard deviation of the distributions (see also Table 2).
Current usage metrics show cumulative count of Article Views (full-text article views including HTML views, PDF and ePub downloads, according to the available data) and Abstracts Views on Vision4Press platform.
Data correspond to usage on the plateform after 2015. The current usage metrics is available 48-96 hours after online publication and is updated daily on week days.
Initial download of the metrics may take a while.