Fig. 11
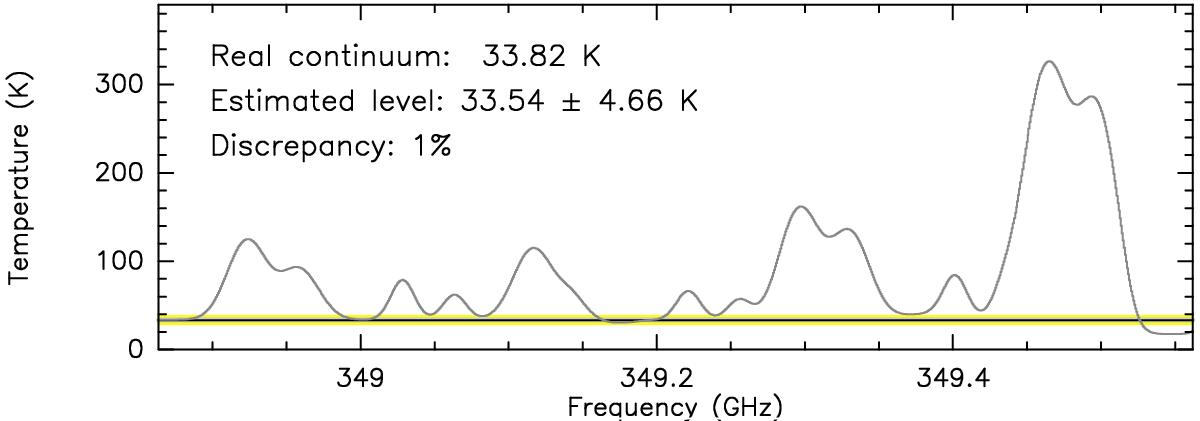
Spectrum extracted at the position depicted in the top panel of Fig. 10. The black solid line indicates the continuum level determined with c-SCM, while the yellow band shows the uncertainty in the determination of the continuum level. The real continuum level as well as the discrepancy between the real and the determined one are listed in the panel.
Current usage metrics show cumulative count of Article Views (full-text article views including HTML views, PDF and ePub downloads, according to the available data) and Abstracts Views on Vision4Press platform.
Data correspond to usage on the plateform after 2015. The current usage metrics is available 48-96 hours after online publication and is updated daily on week days.
Initial download of the metrics may take a while.