Fig. 10
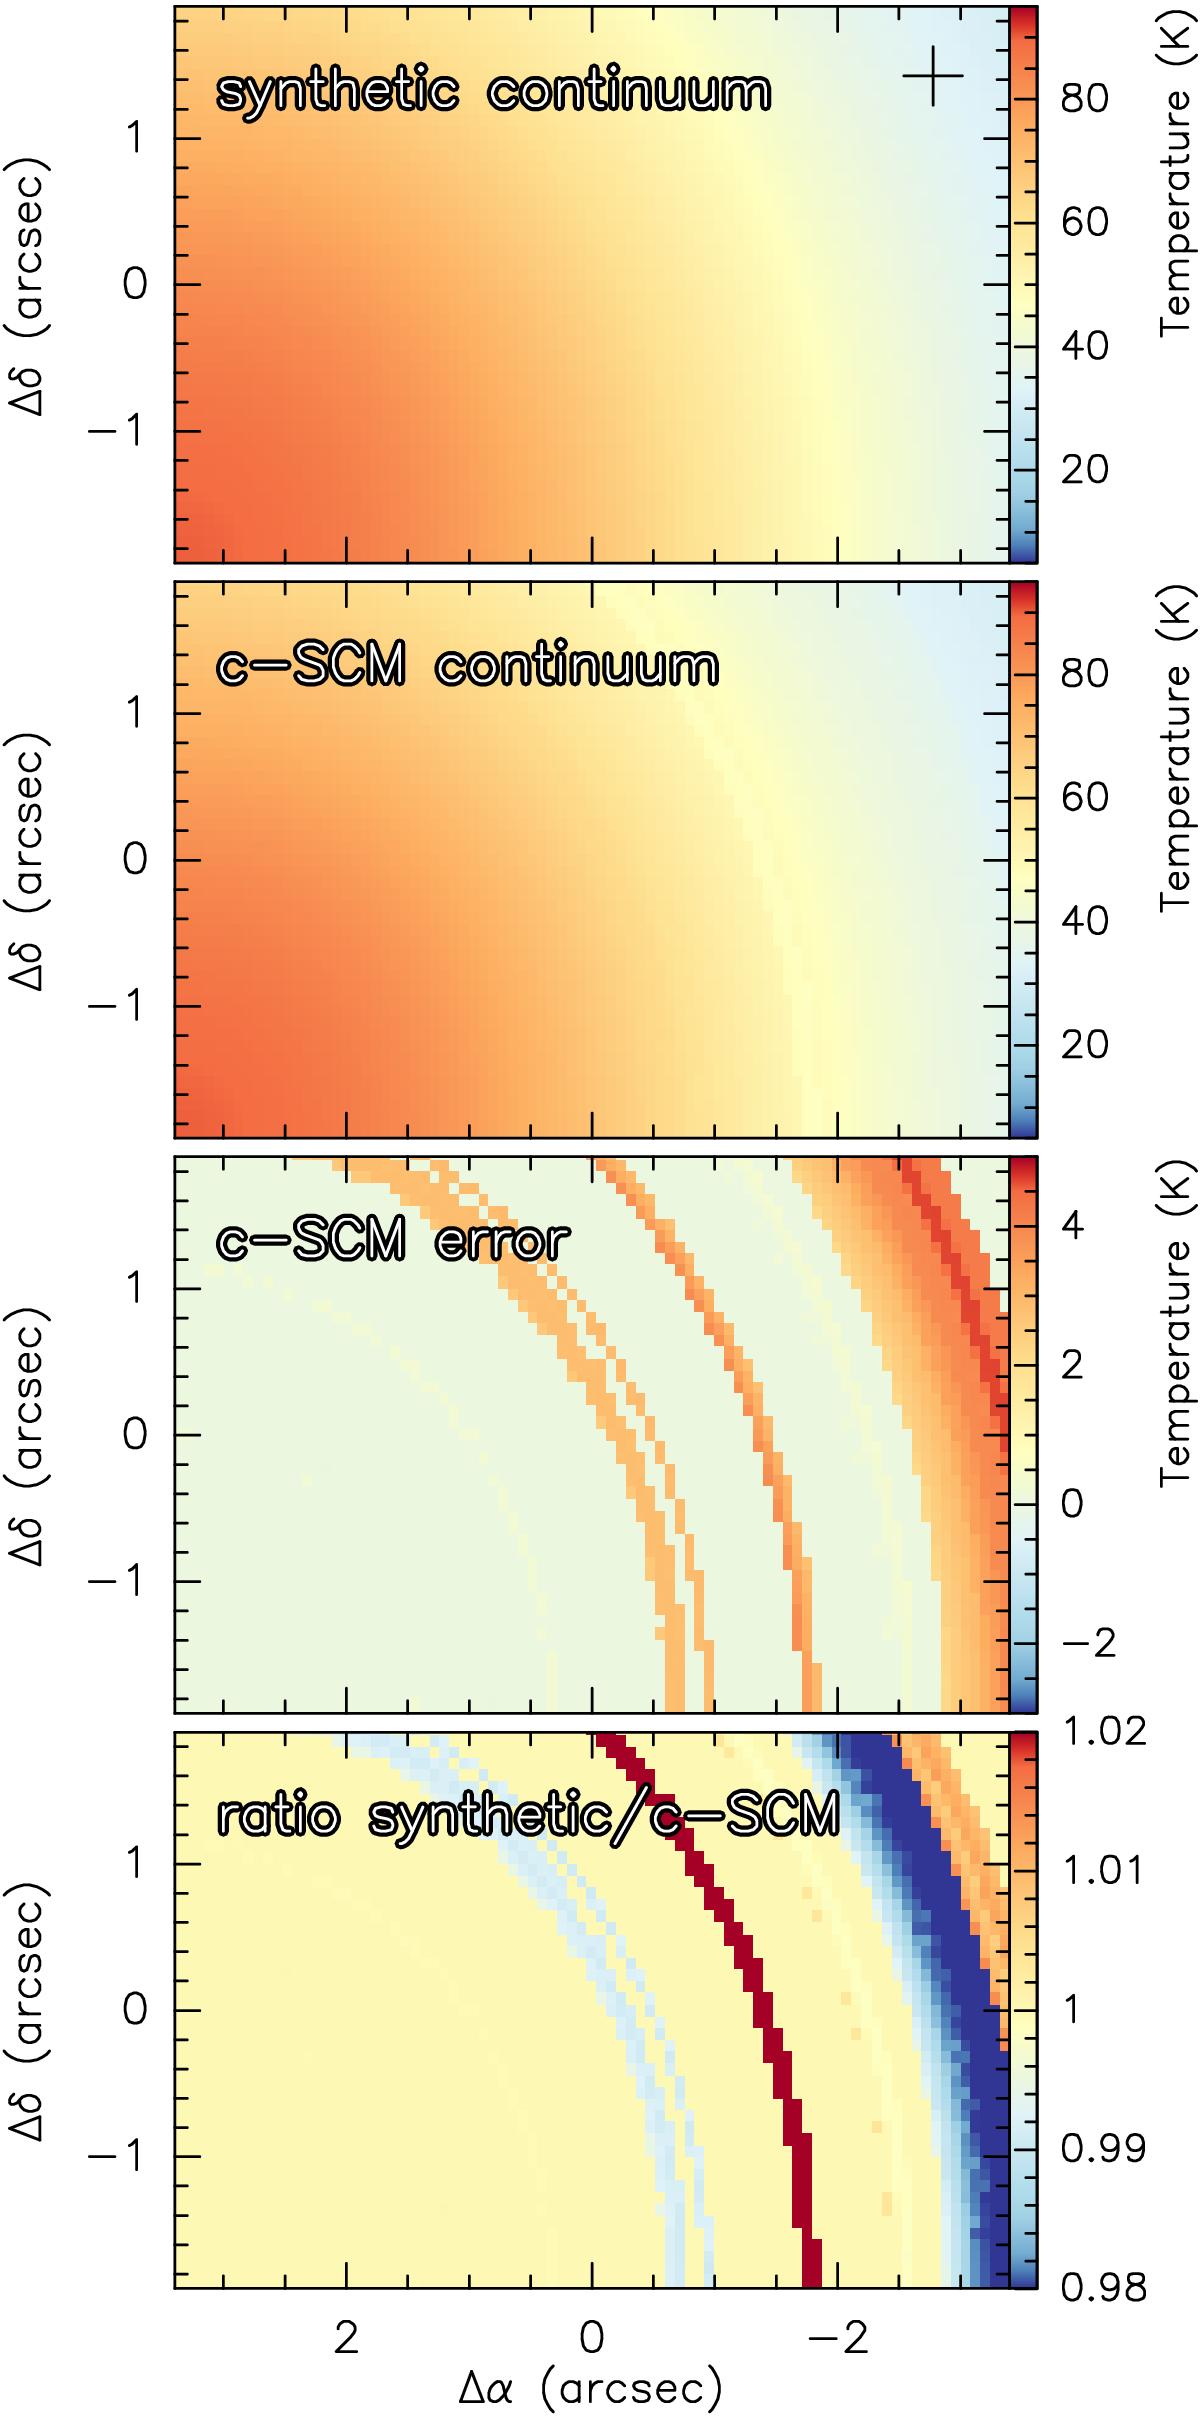
Continuum level determination of a full datacube. The different panels show from top to bottom: (i) Synthetic continuum map created with Xclass. Each pixel of the map contains a crowded-line spectrum with both emission and absorption lines. The black cross marks the position for which the spectrum is shown in Fig. 11; (ii) Continuum map determined by using the c-SCM (see Sects. 2.1 and 2.4); (iii) Uncertainty of the continuum level determination obtained with the c-SCM; (iv) Ratio of the synthetic continuum map over the continuum image produced with the c-SCM.
Current usage metrics show cumulative count of Article Views (full-text article views including HTML views, PDF and ePub downloads, according to the available data) and Abstracts Views on Vision4Press platform.
Data correspond to usage on the plateform after 2015. The current usage metrics is available 48-96 hours after online publication and is updated daily on week days.
Initial download of the metrics may take a while.