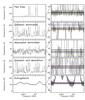
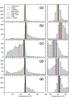
Fig. 1

Schematic description of the process of determination of the continuum level for six different types of spectra: (a) spectrum with few lines, (b) spectrum dominated by emission features, (c) spectrum dominated by absorption features, (d) spectrum with both bright emission and absorption features, and (e) spectrum with broad lines, simulating an extragalactic source (see Sect. 2). From left to right, the different panels show: (left column) synthetic spectra for each case, (middle-left column) close-up view of the synthetic spectra with the continuum level indicated with horizontal colored lines, following the same scheme as in the right-column panels, (middle-right column) histogram created from the synthetic spectra, with the different continuum level estimations indicated with vertical colored lines: “maximum continuum level” in black dotted, “mean continuum level” in black dot-dashed, “median continuum level” in black dotted, “percentile continuum level” in yellow, “Gaussian continuum level” in red, “KDE continuum level” in blue, “sigma-clip continuum level” or SCM in black, and “corrected sigma-clip continuum level” or cSCM in thick black (see Sect. 2.1 for details of the different methods). The green solid line depicts the KDE, and (right column) close-up view of the histogram around the 50 K value. The exact values of the continuum levels are listed in Table 1. The mean, median and Gaussian continuum levels correspond to the entire distribution (Cols. 3, 5 and 8 of Table 1, respectively). The 75th percentile is used for case (c) and the 25th percentile for all the other cases.
Current usage metrics show cumulative count of Article Views (full-text article views including HTML views, PDF and ePub downloads, according to the available data) and Abstracts Views on Vision4Press platform.
Data correspond to usage on the plateform after 2015. The current usage metrics is available 48-96 hours after online publication and is updated daily on week days.
Initial download of the metrics may take a while.