Free Access
Fig. 9
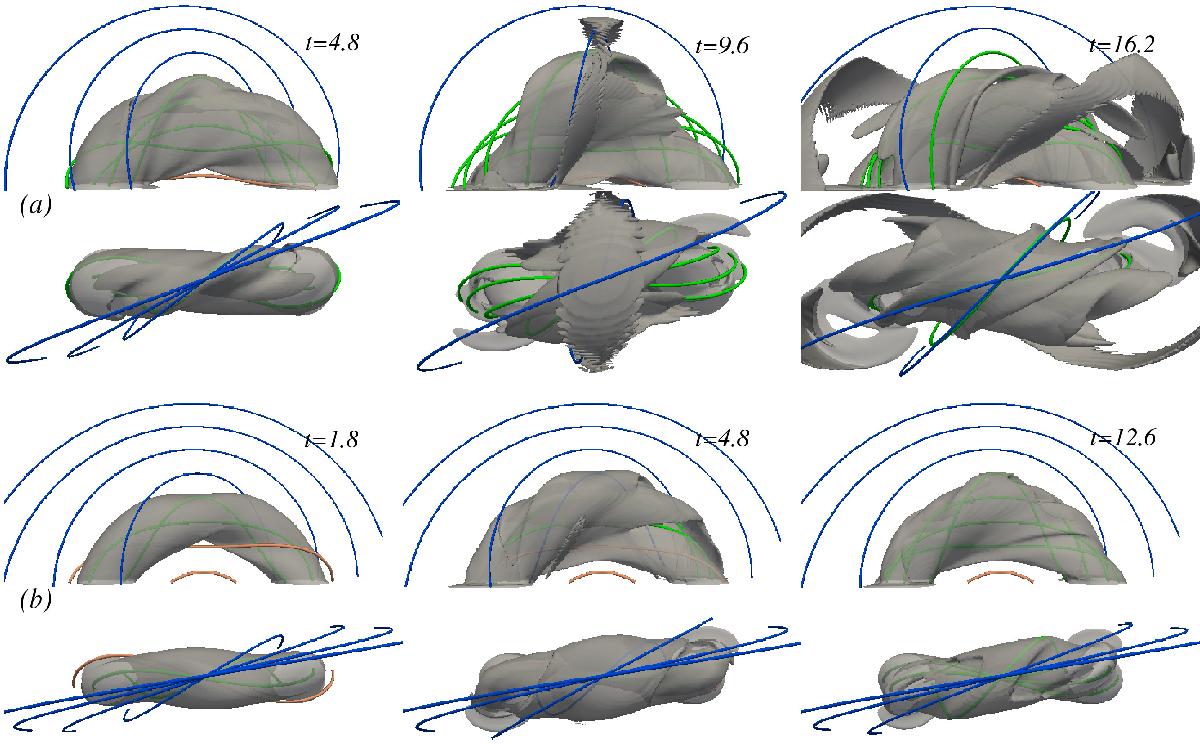
Evolution snapshots of cases refTDb (top row a) and intkink (bottom row b). The colored curves represent the magnetic field lines outside (blue and orange) and inside (green) the MFR. Translucent isosurfaces indicate the current structures of the MFR.
Current usage metrics show cumulative count of Article Views (full-text article views including HTML views, PDF and ePub downloads, according to the available data) and Abstracts Views on Vision4Press platform.
Data correspond to usage on the plateform after 2015. The current usage metrics is available 48-96 hours after online publication and is updated daily on week days.
Initial download of the metrics may take a while.