Free Access
Fig. 12
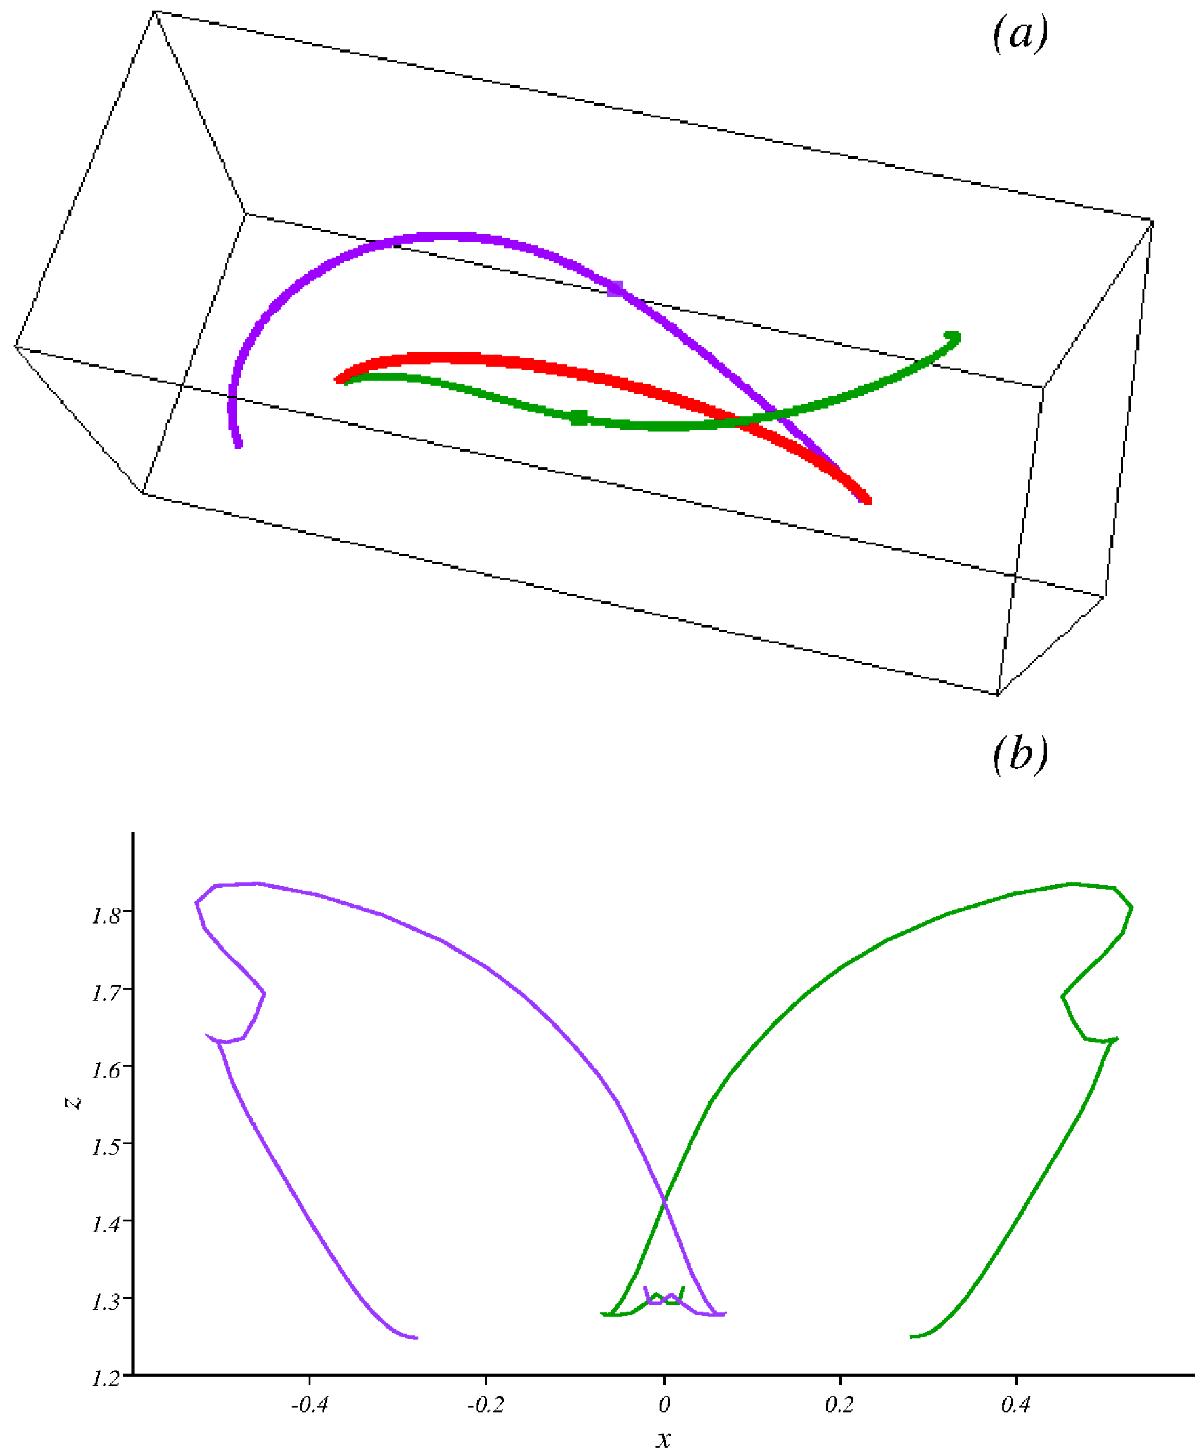
Panel a: colored magnetic field lines whose start points are on the left (green) and right (purple) foot points of MFR at t = 5.4. The red arch represents the initial magnetic axis. Panel b: trajectory of crossing points between the panel y = 0 and magnetic field lines.
Current usage metrics show cumulative count of Article Views (full-text article views including HTML views, PDF and ePub downloads, according to the available data) and Abstracts Views on Vision4Press platform.
Data correspond to usage on the plateform after 2015. The current usage metrics is available 48-96 hours after online publication and is updated daily on week days.
Initial download of the metrics may take a while.