Fig. 8
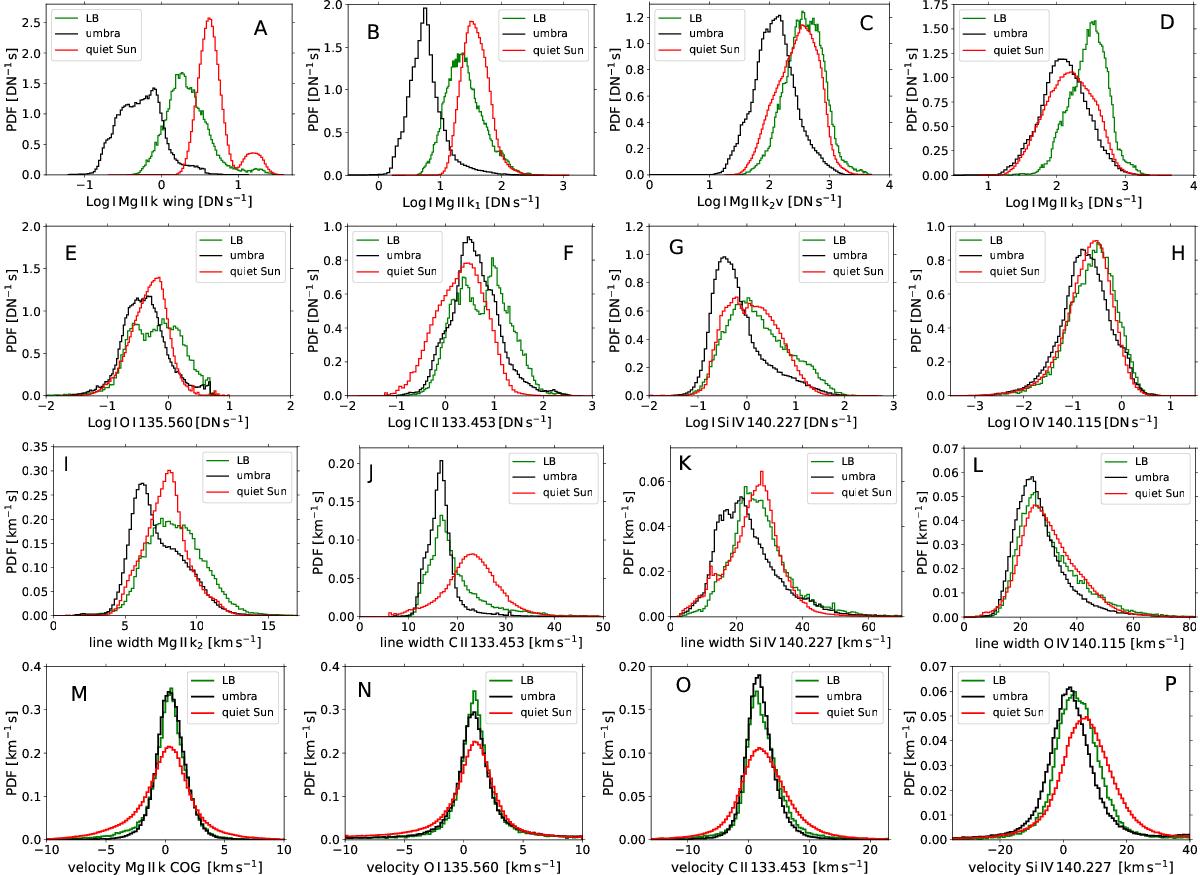
Distribution of the intensity, line width, and velocity in the LB sample (green) compared to the umbra (black) and quiet Sun (red) samples. The quiet Sun area surrounding sunspots includes some plage regions seen as a secondary population in the photosphere (panel A). Histograms of the intensity parameters are shown in panels A–H, while panels I–L, and M–P show histograms of the line widths and velocities, respectively. The line width of Mg ii k2 shown on panel (I) marks the average width of the two Gaussians used to fit the line. All intensity parameters (panels A–H) were normalized to the corresponding integration times. Positive velocity denotes redshift.
Current usage metrics show cumulative count of Article Views (full-text article views including HTML views, PDF and ePub downloads, according to the available data) and Abstracts Views on Vision4Press platform.
Data correspond to usage on the plateform after 2015. The current usage metrics is available 48-96 hours after online publication and is updated daily on week days.
Initial download of the metrics may take a while.