Free Access
Fig. 2
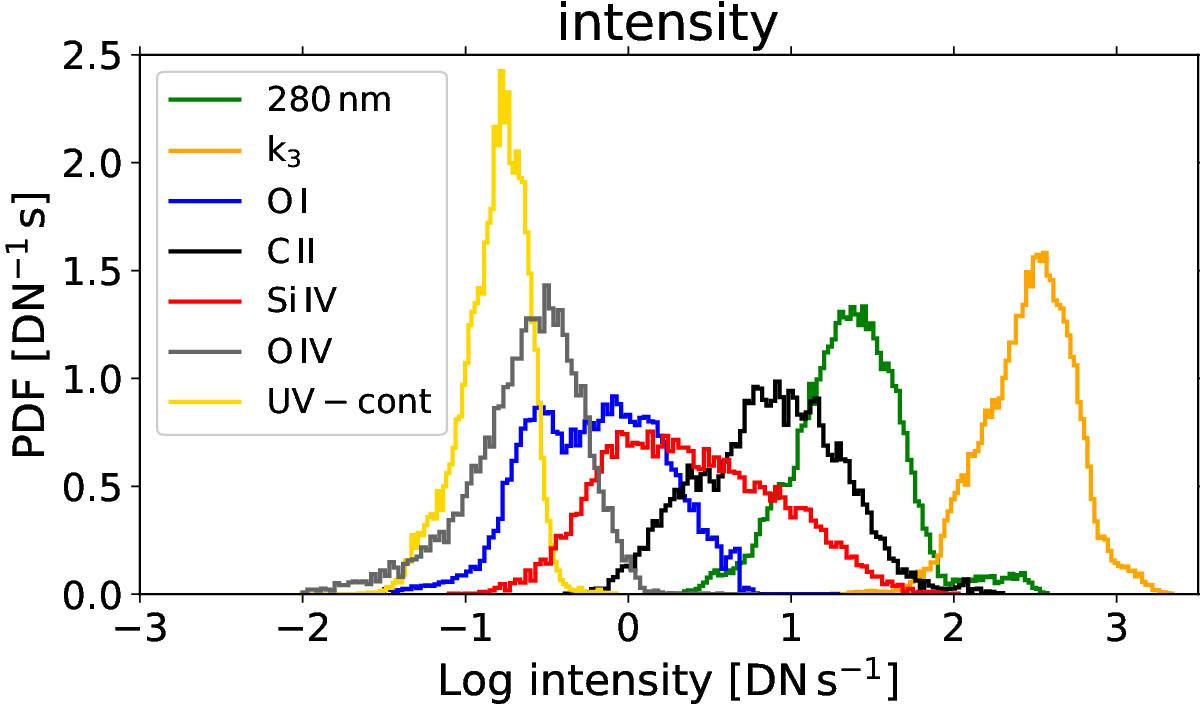
Histograms of the line and continuum intensities in the LB sample. Intensities are normalized to the integration time. The core intensity of the Mg ii k line is denoted k3. The LB sample includes 42 436 entries from 60 LBs. We used 100 bins in all histograms.
Current usage metrics show cumulative count of Article Views (full-text article views including HTML views, PDF and ePub downloads, according to the available data) and Abstracts Views on Vision4Press platform.
Data correspond to usage on the plateform after 2015. The current usage metrics is available 48-96 hours after online publication and is updated daily on week days.
Initial download of the metrics may take a while.