Fig. 1
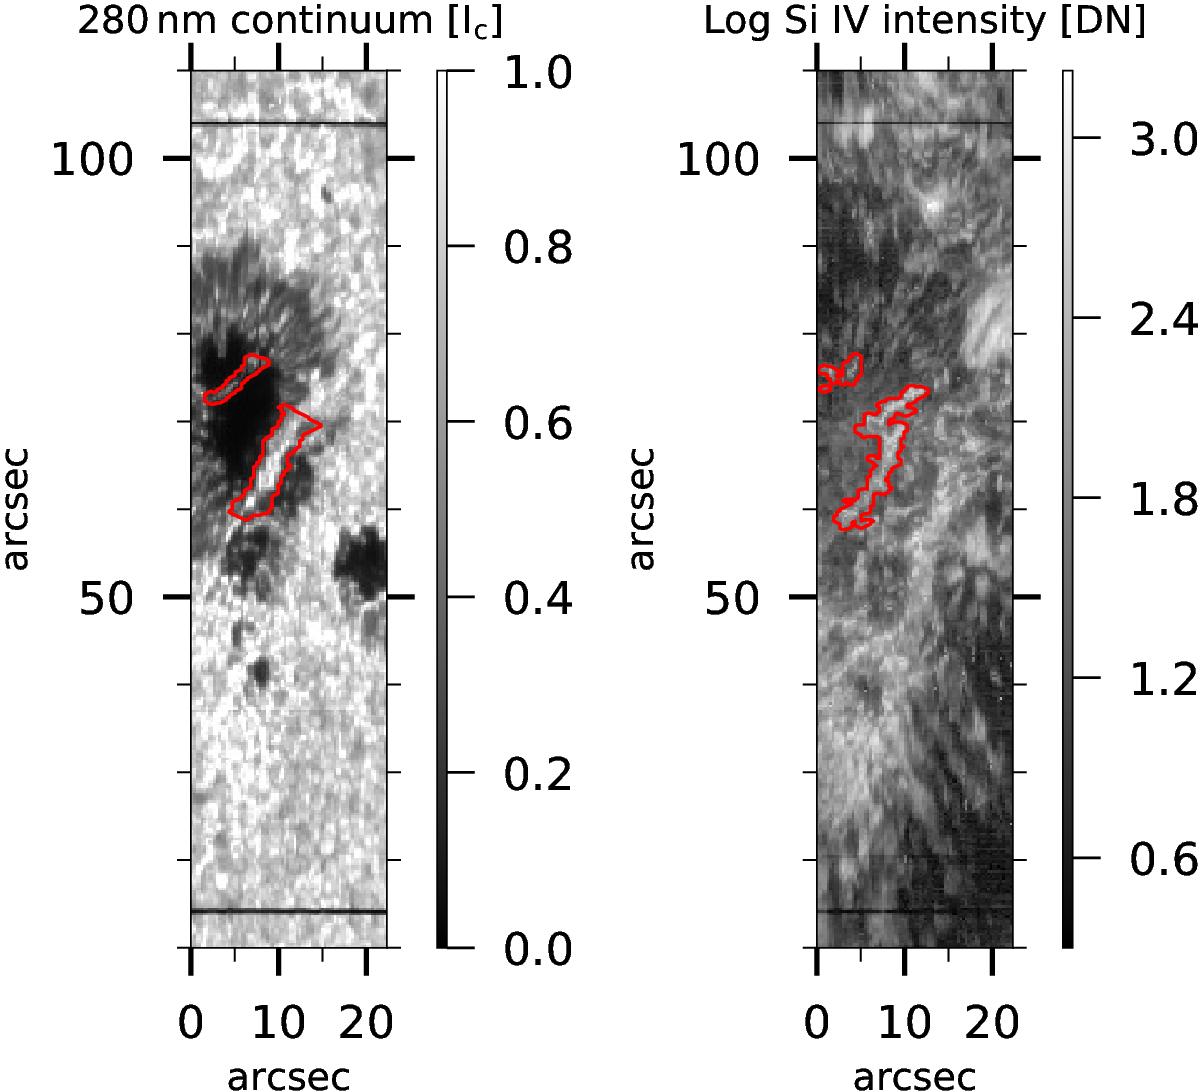
IRIS maps of observation #10 in Table 1. The left panel displays the photospheric continuum map normalized to the average quiet Sun intensity. Theright panel shows the logarithm of the intensity of the Si iv 140.3 nm line measured with a Gaussian fit (see Sect. 2.2 for more details). The 280 nm and silicon masks of the two LBs are marked on the corresponding panels. Both maps were clipped for a better visibility. The widths of the LBs are comparable in the photosphere and the TR. We note the relative shift of the LBs in the two maps. The solar limb is toward the left.
Current usage metrics show cumulative count of Article Views (full-text article views including HTML views, PDF and ePub downloads, according to the available data) and Abstracts Views on Vision4Press platform.
Data correspond to usage on the plateform after 2015. The current usage metrics is available 48-96 hours after online publication and is updated daily on week days.
Initial download of the metrics may take a while.