Fig. 3
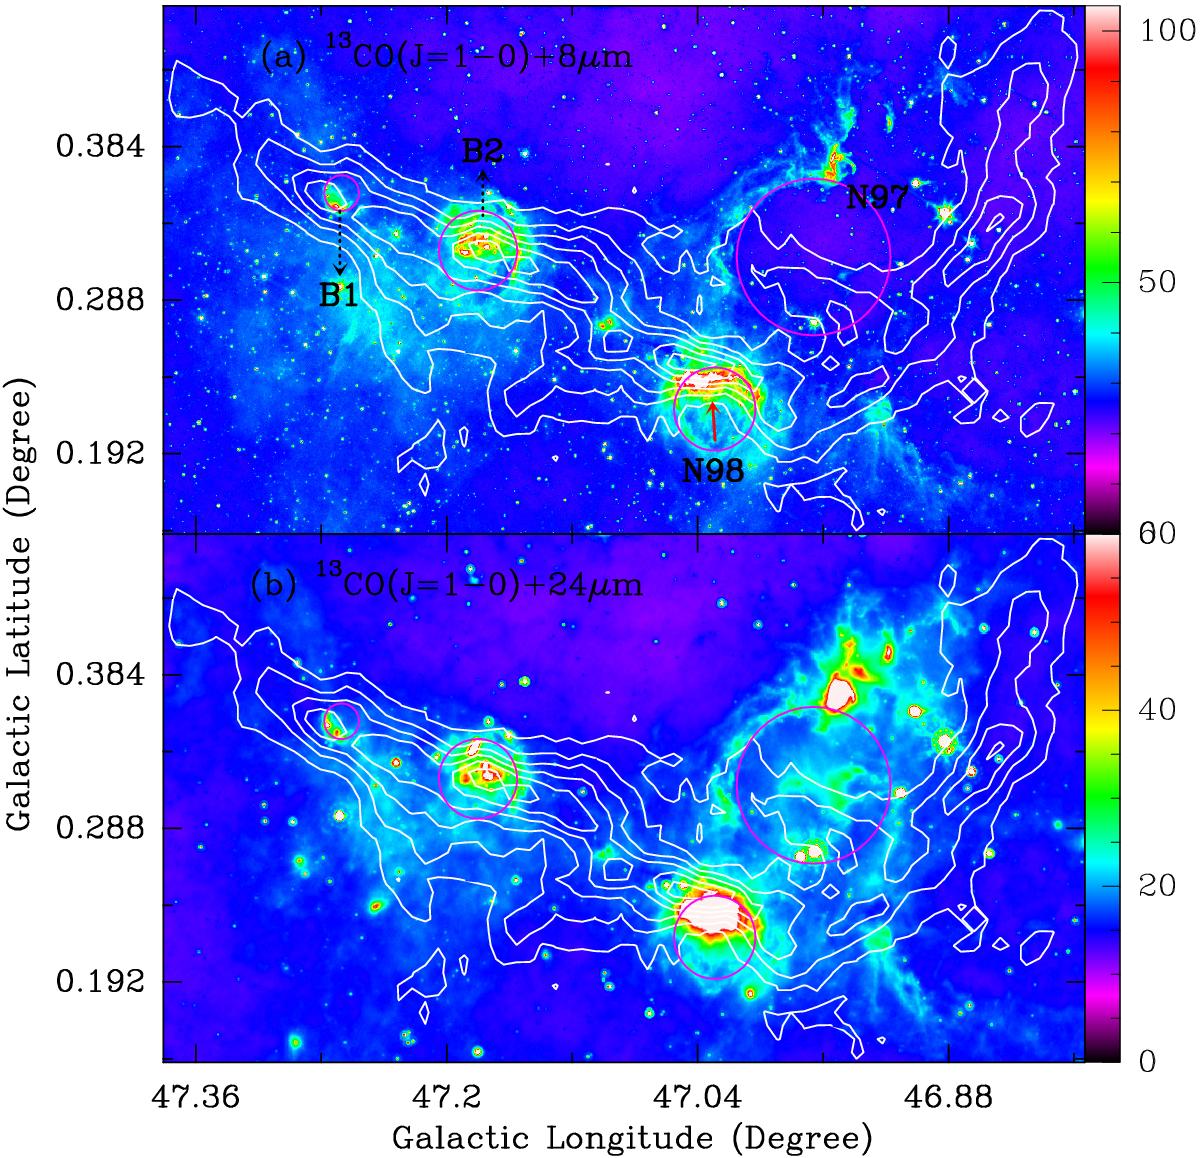
Panel a: 13CO J = 1−0 emission map (white contours) superimposed on the Spitzer-IRAC 8 μm emission map (color scale). The red arrow indicates steep integrated intensity gradients. Panel b: 13CO J = 1−0 emission map (white contours) superimposed on the Spitzer-MIPSGAL 24 μm emission (color scale). The four pink circles represent infrared bubbles. B1 is bubble MWP1G047270+003500S, while B2 is MWP1G047180+003195. The right color-bar is in units of mJy sr-1.
Current usage metrics show cumulative count of Article Views (full-text article views including HTML views, PDF and ePub downloads, according to the available data) and Abstracts Views on Vision4Press platform.
Data correspond to usage on the plateform after 2015. The current usage metrics is available 48-96 hours after online publication and is updated daily on week days.
Initial download of the metrics may take a while.