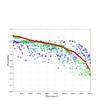
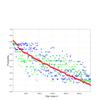
Fig. 3
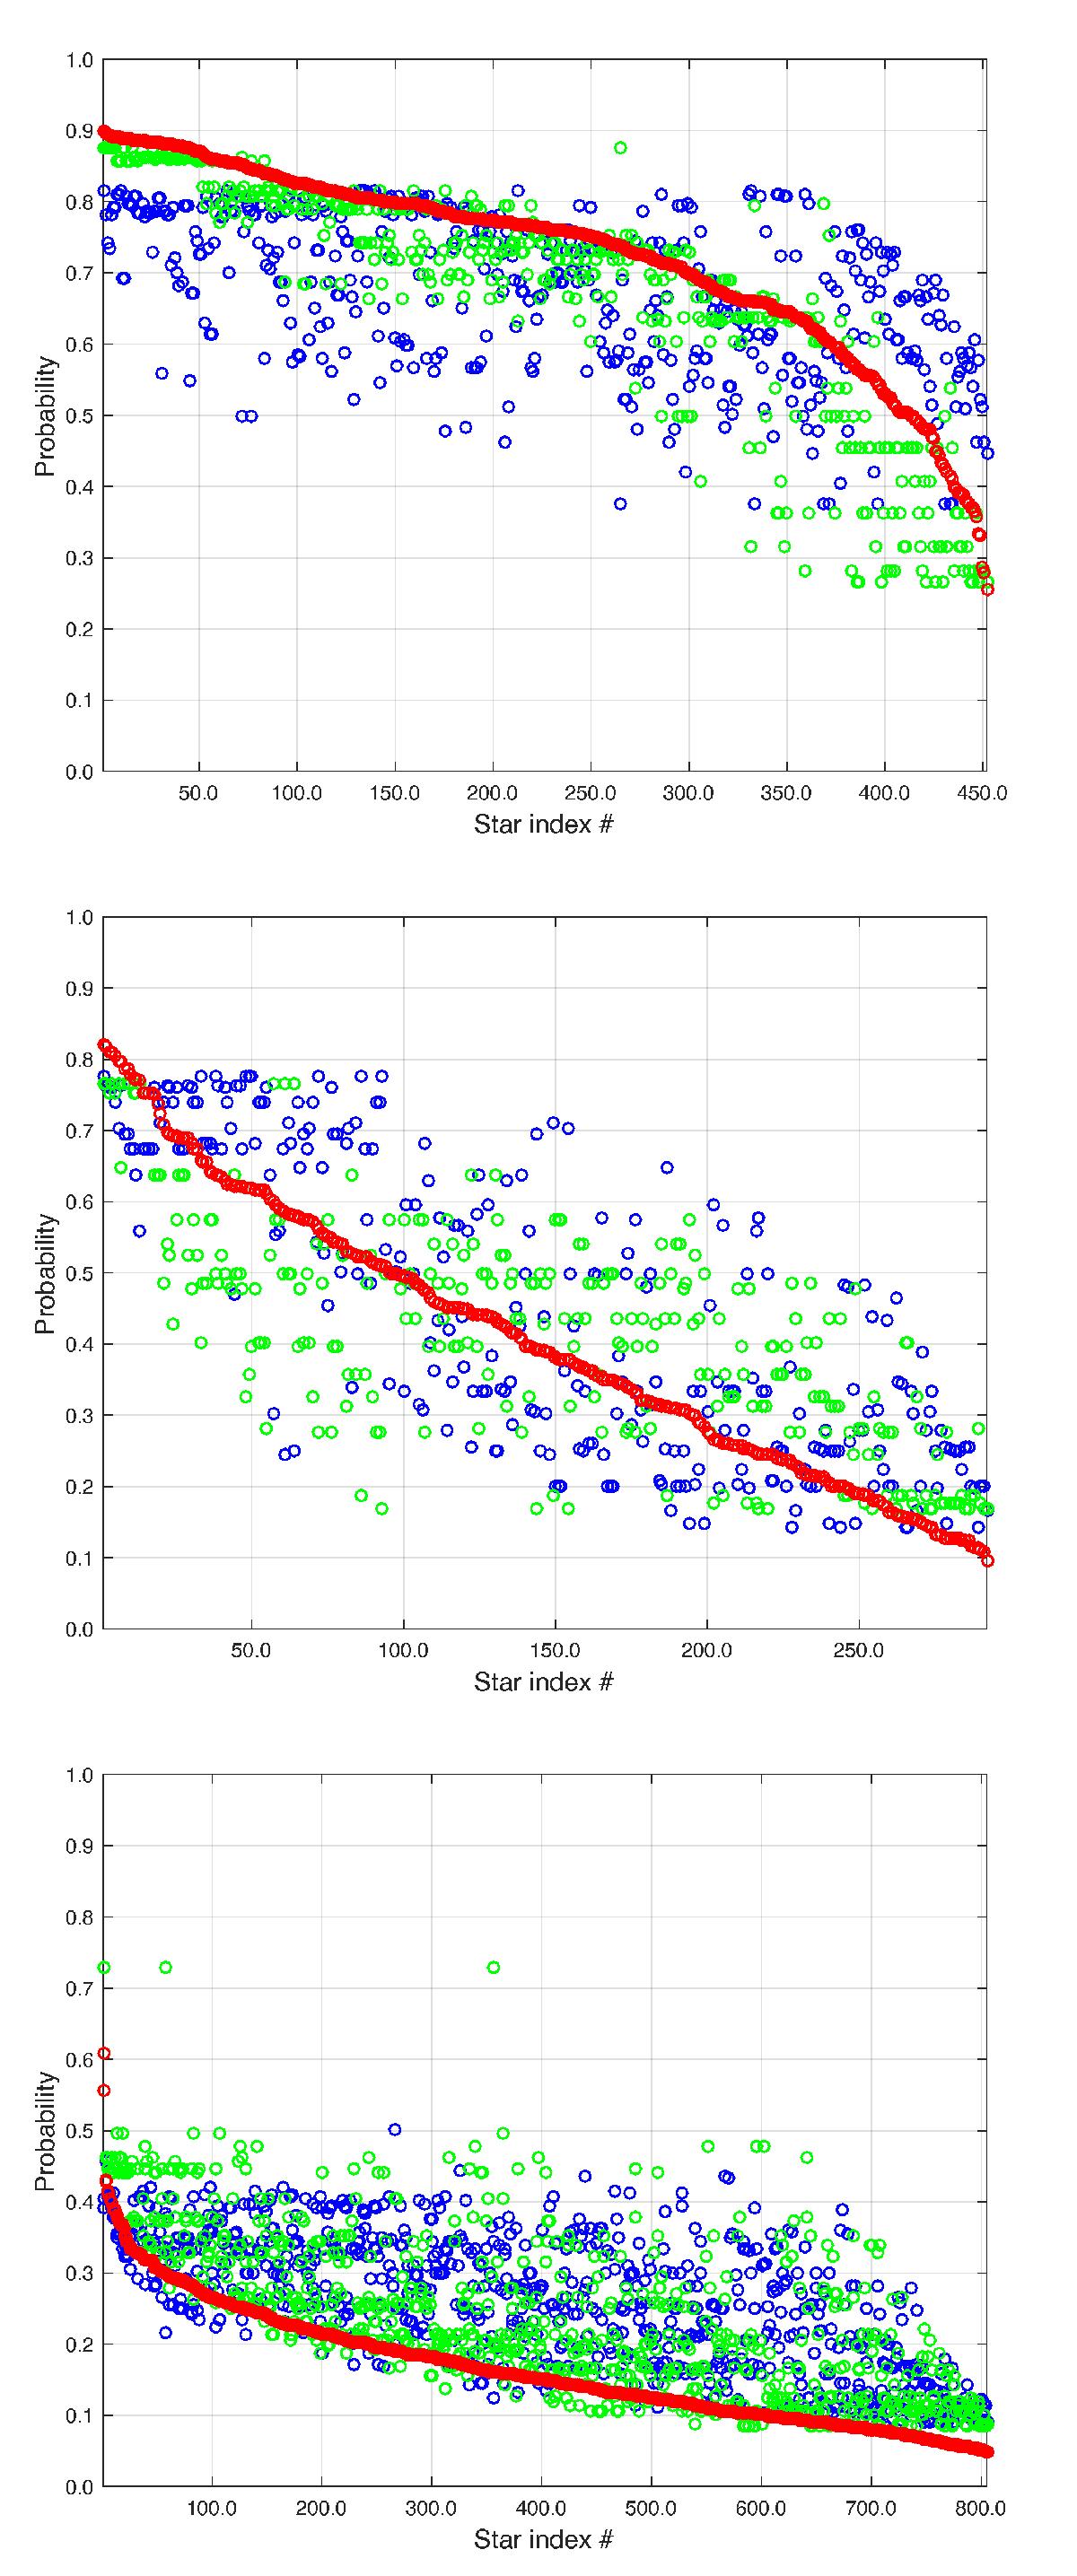
Cluster membership probabilities for M 67 (top), NGC 654 (middle), and a cluster-free section of sky (bottom). Blue circles are the astrometric probabilities, green circles are the photometric probabilities, and red circles are the inferred joint distribution; the x-axis is the star’s identifying index (sorted by increasing joint probability). Typical variances for the estimated probabilities are on the order of ![]() –0.03.
–0.03.
Current usage metrics show cumulative count of Article Views (full-text article views including HTML views, PDF and ePub downloads, according to the available data) and Abstracts Views on Vision4Press platform.
Data correspond to usage on the plateform after 2015. The current usage metrics is available 48-96 hours after online publication and is updated daily on week days.
Initial download of the metrics may take a while.