Free Access
Fig. 2
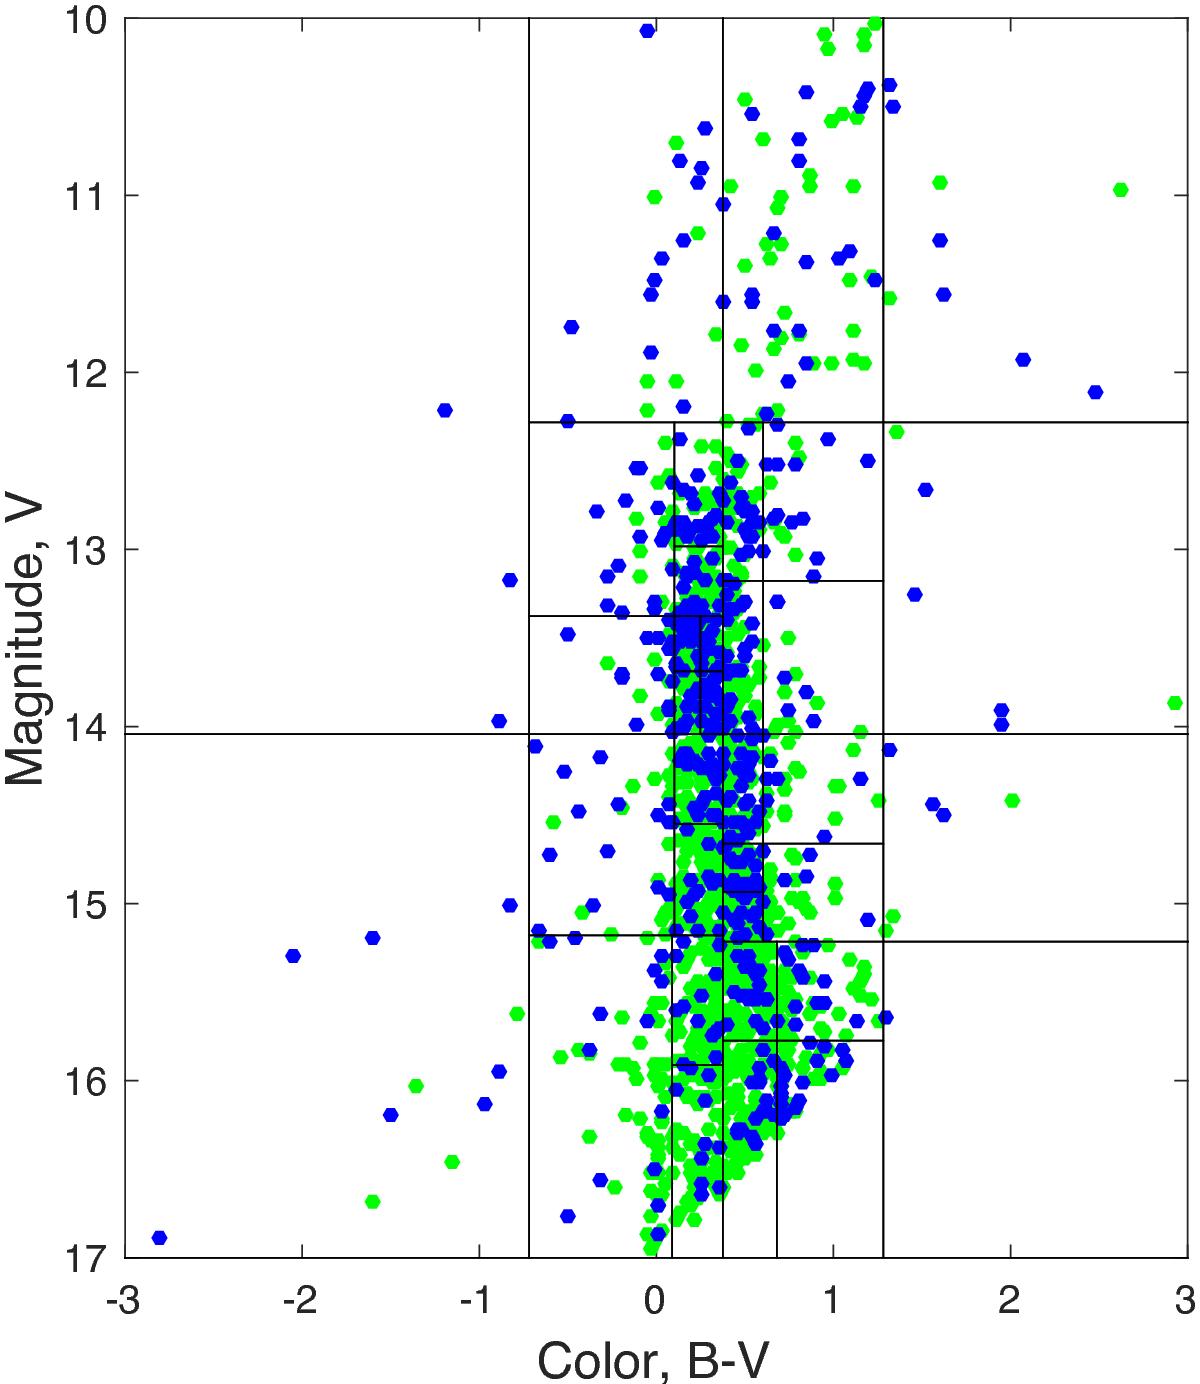
color–magnitude diagrams of the M67 reference (green) and program (blue) fields. The boxes show the adaptively sized bins used to calculate the photometric distribution. The reference field is significantly larger than the program field and thus has more stars, but otherwise the distributions look very similar to the eye.
Current usage metrics show cumulative count of Article Views (full-text article views including HTML views, PDF and ePub downloads, according to the available data) and Abstracts Views on Vision4Press platform.
Data correspond to usage on the plateform after 2015. The current usage metrics is available 48-96 hours after online publication and is updated daily on week days.
Initial download of the metrics may take a while.