Fig. 9
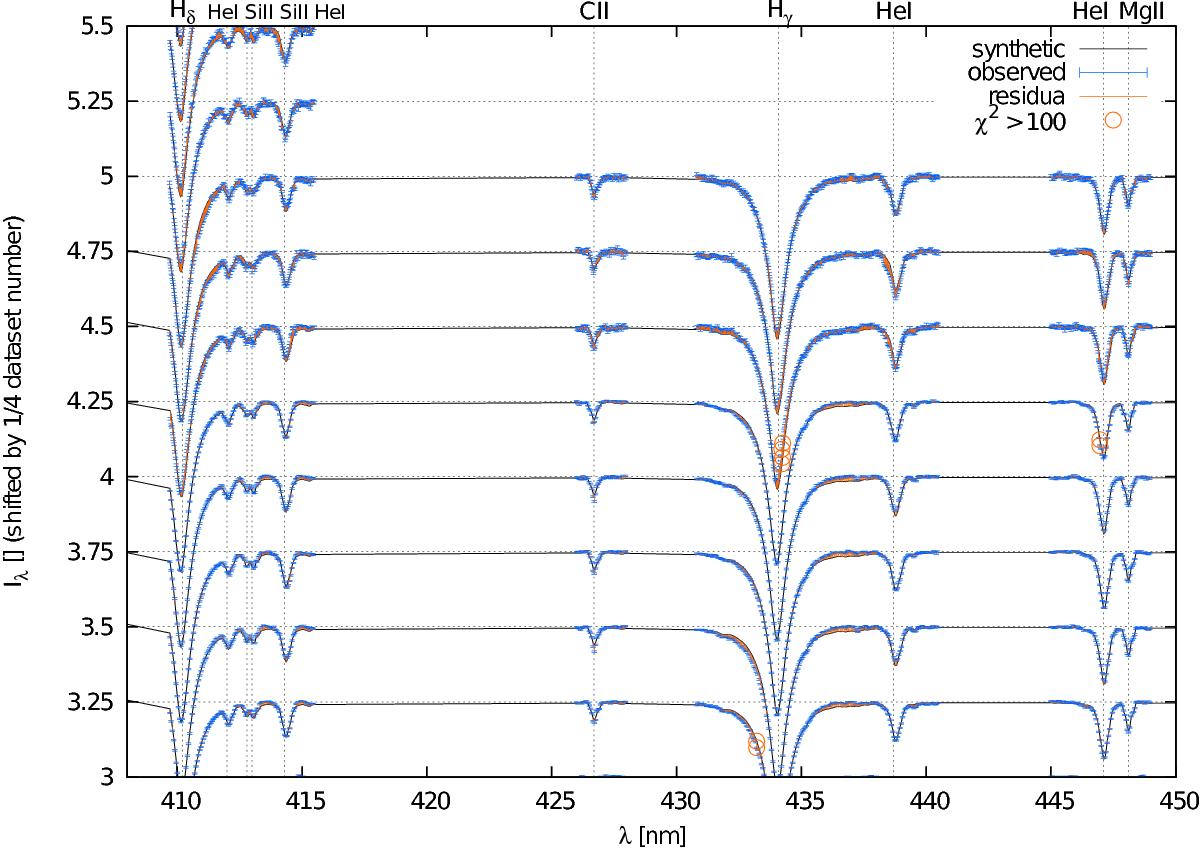
Subset of synthetic spectra ![]() of V746 Cas (black line) for the nominal model with χ2 = 157 756 compared to the normalized observed ones (blue error bars). Only a region between 408 and 450 nm is shown, with a number of indicative lines: Hδ, HeI, SiII, SiII, HeI, CII, Hγ, HeI, HeI, and MgII. The synthetic spectra were interpolated to the observed wavelengths. The differences are denoted by red lines, or even red circles if the respective contribution to
of V746 Cas (black line) for the nominal model with χ2 = 157 756 compared to the normalized observed ones (blue error bars). Only a region between 408 and 450 nm is shown, with a number of indicative lines: Hδ, HeI, SiII, SiII, HeI, CII, Hγ, HeI, HeI, and MgII. The synthetic spectra were interpolated to the observed wavelengths. The differences are denoted by red lines, or even red circles if the respective contribution to ![]() is larger than 100. Note it is difficult to improve the solution because our N-body model does not fit the spectra one-by-one or individual lines, but rather fits all the spectra at once. For example, the problematic synthetic spectrum of Hγ in the middle of the figure cannot be simply shifted to the left. These systematics may at least partly be caused by the rectification procedure.
is larger than 100. Note it is difficult to improve the solution because our N-body model does not fit the spectra one-by-one or individual lines, but rather fits all the spectra at once. For example, the problematic synthetic spectrum of Hγ in the middle of the figure cannot be simply shifted to the left. These systematics may at least partly be caused by the rectification procedure.
Current usage metrics show cumulative count of Article Views (full-text article views including HTML views, PDF and ePub downloads, according to the available data) and Abstracts Views on Vision4Press platform.
Data correspond to usage on the plateform after 2015. The current usage metrics is available 48-96 hours after online publication and is updated daily on week days.
Initial download of the metrics may take a while.