Fig. 8
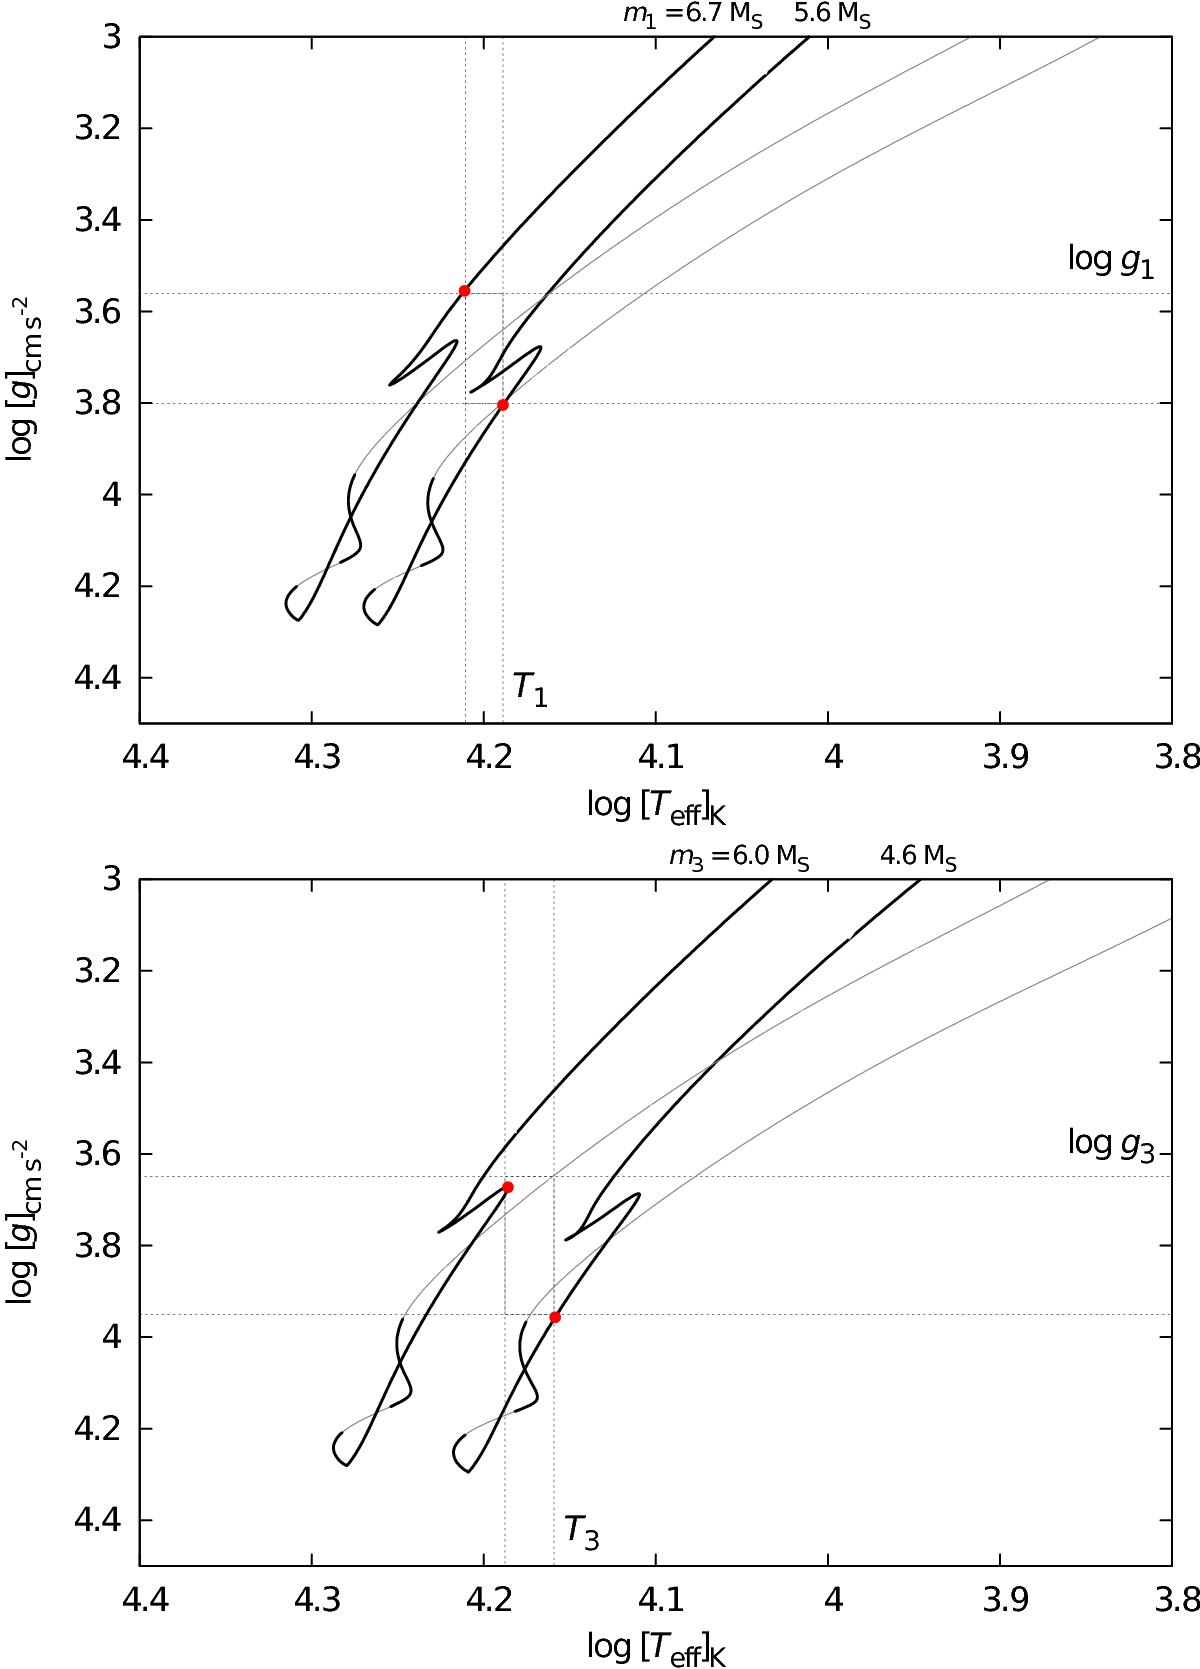
Evolutionary tracks in effective temperature Teff vs. surface gravity log g plots, including pre-MS (thin line), MS, and SGB phases (thick line). The horizontal and vertical dotted lines correspond to the allowed 1σ ranges of the respective parameters, according to Table 6. The top panel shows the primary component of V746 Cas for the two values of its mass m1 = 5.6 M⊙ and 6.7 M⊙. The bottom panel shows the tertiary for m3 = 4.6 M⊙ and 6.0 M⊙.
Current usage metrics show cumulative count of Article Views (full-text article views including HTML views, PDF and ePub downloads, according to the available data) and Abstracts Views on Vision4Press platform.
Data correspond to usage on the plateform after 2015. The current usage metrics is available 48-96 hours after online publication and is updated daily on week days.
Initial download of the metrics may take a while.