Fig. 7
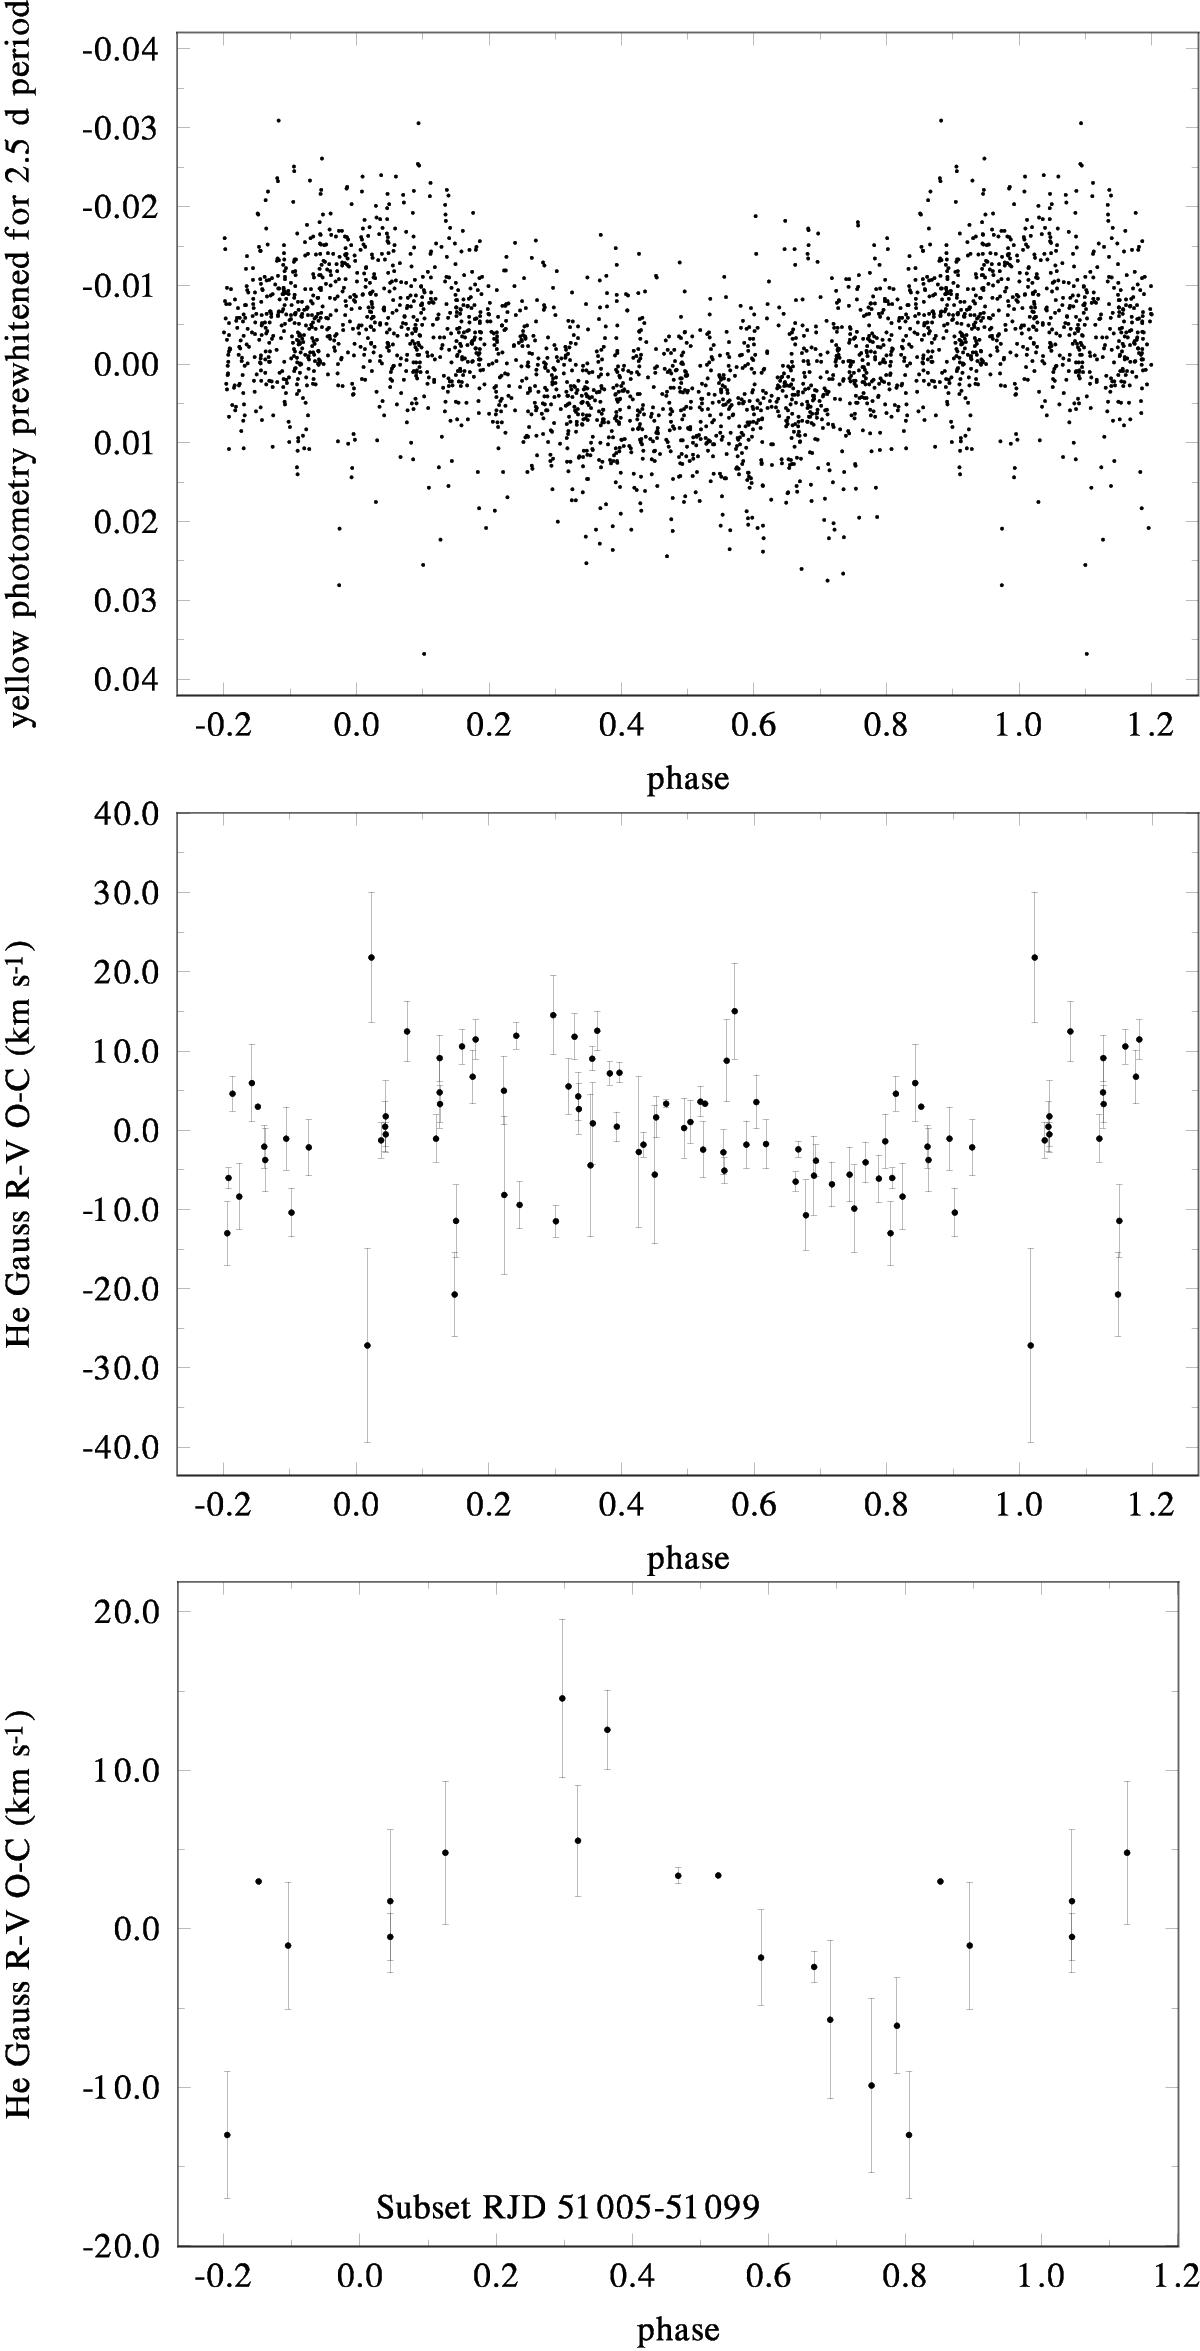
Phase plots for the 1![]() 06495 period calculated using ephemeris 2. Top: all yellow-band photometry O–C residuals prewhitened for the 2.5 d period and its harmonics are shown. Middle: a plot of all the residuals from the orbital solution for the Gaussian-fit He i 6678 Å RVs. Bottom: a plot of the residuals from the orbital solution for the Gaussian fit He i 6678 Å RVs for the subset of Aurelie spectra.
06495 period calculated using ephemeris 2. Top: all yellow-band photometry O–C residuals prewhitened for the 2.5 d period and its harmonics are shown. Middle: a plot of all the residuals from the orbital solution for the Gaussian-fit He i 6678 Å RVs. Bottom: a plot of the residuals from the orbital solution for the Gaussian fit He i 6678 Å RVs for the subset of Aurelie spectra.
Current usage metrics show cumulative count of Article Views (full-text article views including HTML views, PDF and ePub downloads, according to the available data) and Abstracts Views on Vision4Press platform.
Data correspond to usage on the plateform after 2015. The current usage metrics is available 48-96 hours after online publication and is updated daily on week days.
Initial download of the metrics may take a while.