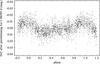
Fig. 6

Phase plots for the 2![]() 503867 period calculated using ephemeris 3. Top: a phase plot of all yellow-band photometric observations prewhitened for the 1
503867 period calculated using ephemeris 3. Top: a phase plot of all yellow-band photometric observations prewhitened for the 1![]() 06495 period. Middle: a phase plot of the magnetic field observations from measurements of Neiner et al. (2014) from spectra not affected by technical problems and for the mean values from all lines. The rms errors of the measurements are shown by the error bars. Bottom: a phase plot of the Gaussian-fit He i 6678 Å RVs.
06495 period. Middle: a phase plot of the magnetic field observations from measurements of Neiner et al. (2014) from spectra not affected by technical problems and for the mean values from all lines. The rms errors of the measurements are shown by the error bars. Bottom: a phase plot of the Gaussian-fit He i 6678 Å RVs.


Current usage metrics show cumulative count of Article Views (full-text article views including HTML views, PDF and ePub downloads, according to the available data) and Abstracts Views on Vision4Press platform.
Data correspond to usage on the plateform after 2015. The current usage metrics is available 48-96 hours after online publication and is updated daily on week days.
Initial download of the metrics may take a while.