Fig. 2
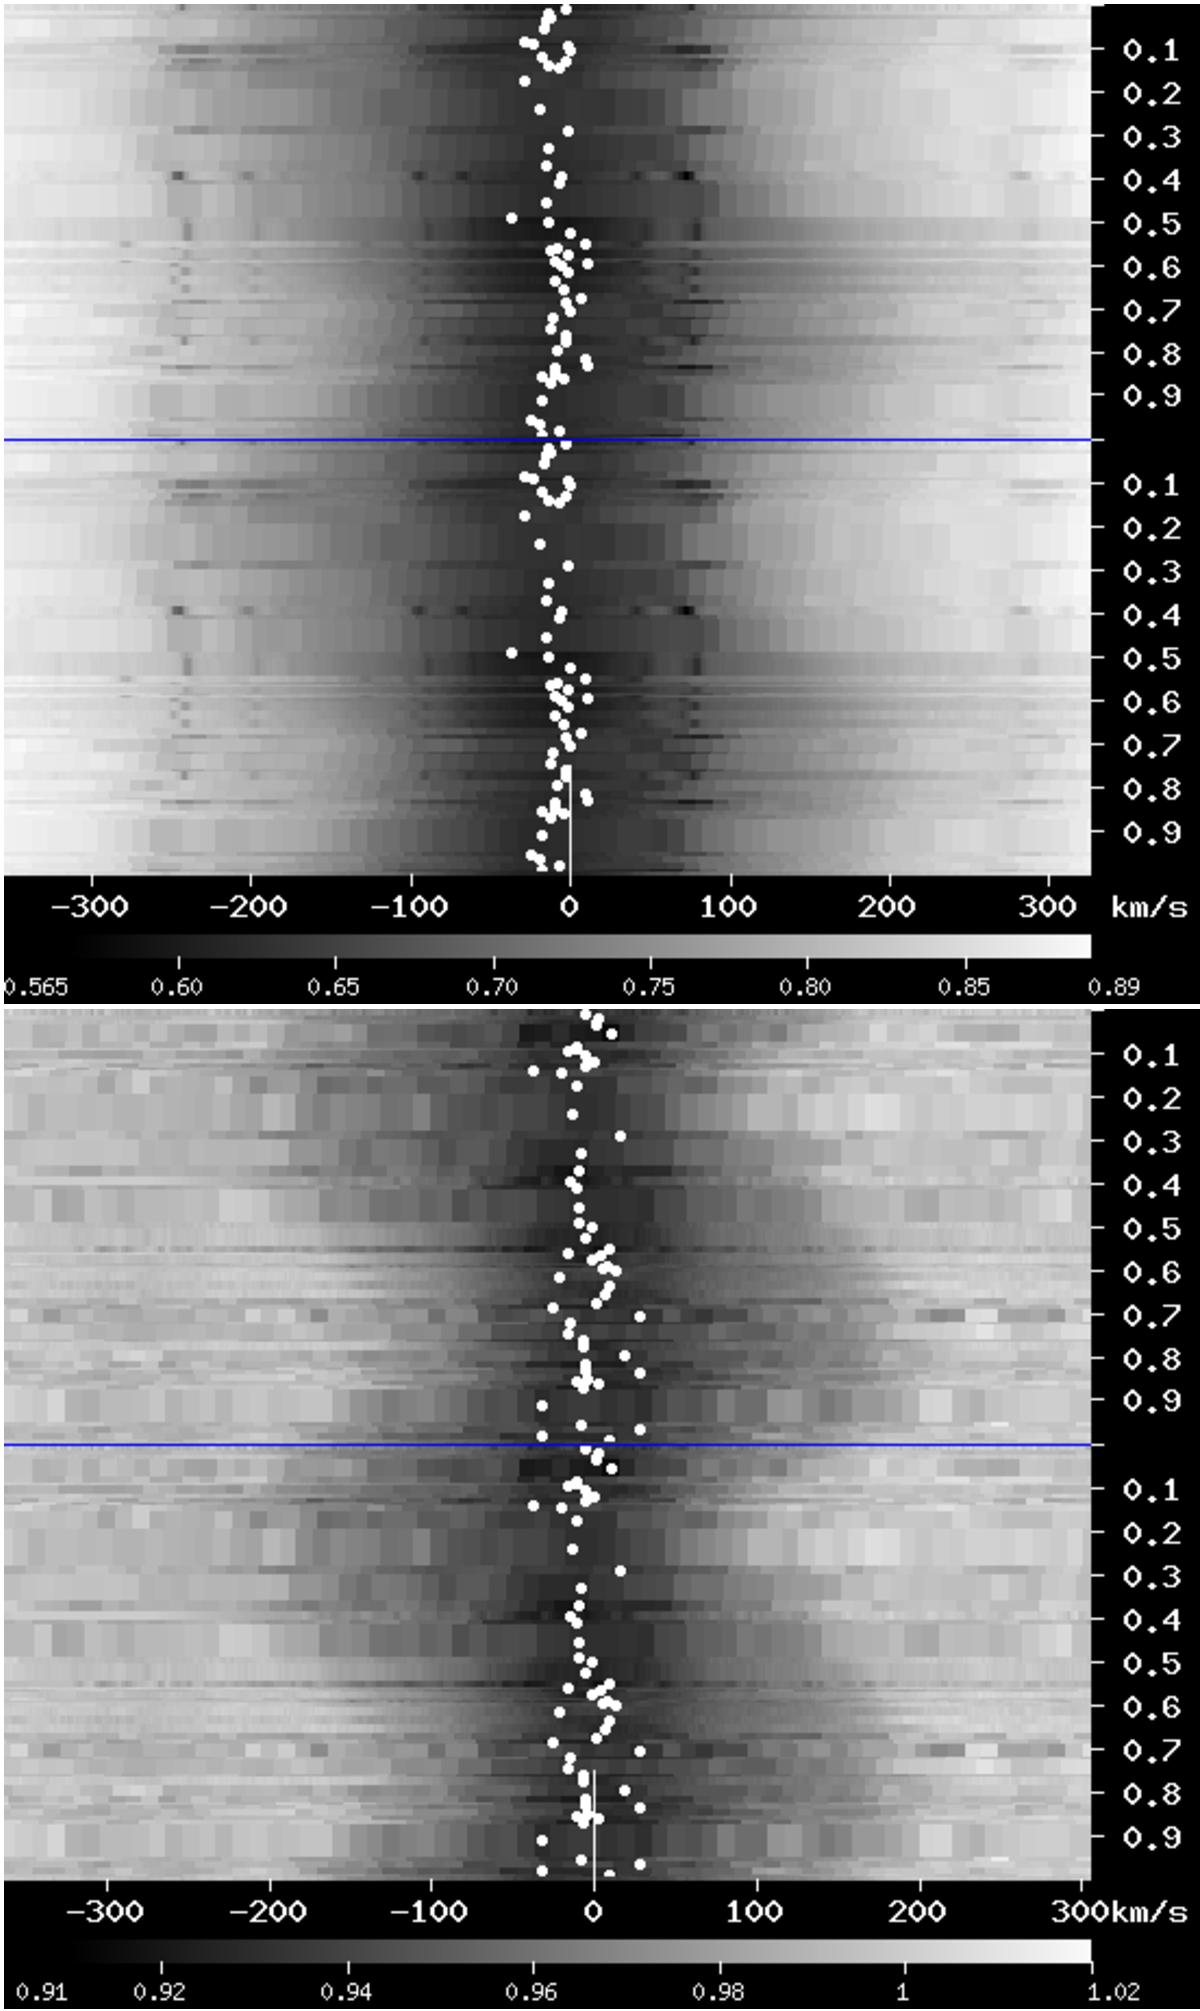
Dynamical spectra plotted vs. orbital phase of the 25![]() 416 period with phase zero at superior conjunction. Lines of Hα (top panel) and He i 6678 Å (bottom panel) are shown. The white dots denote the RV position of the deepest point of each line profile to show that the position of the line cores does not vary with the 25
416 period with phase zero at superior conjunction. Lines of Hα (top panel) and He i 6678 Å (bottom panel) are shown. The white dots denote the RV position of the deepest point of each line profile to show that the position of the line cores does not vary with the 25![]() 416 period.
416 period.
Current usage metrics show cumulative count of Article Views (full-text article views including HTML views, PDF and ePub downloads, according to the available data) and Abstracts Views on Vision4Press platform.
Data correspond to usage on the plateform after 2015. The current usage metrics is available 48-96 hours after online publication and is updated daily on week days.
Initial download of the metrics may take a while.