Fig. 12
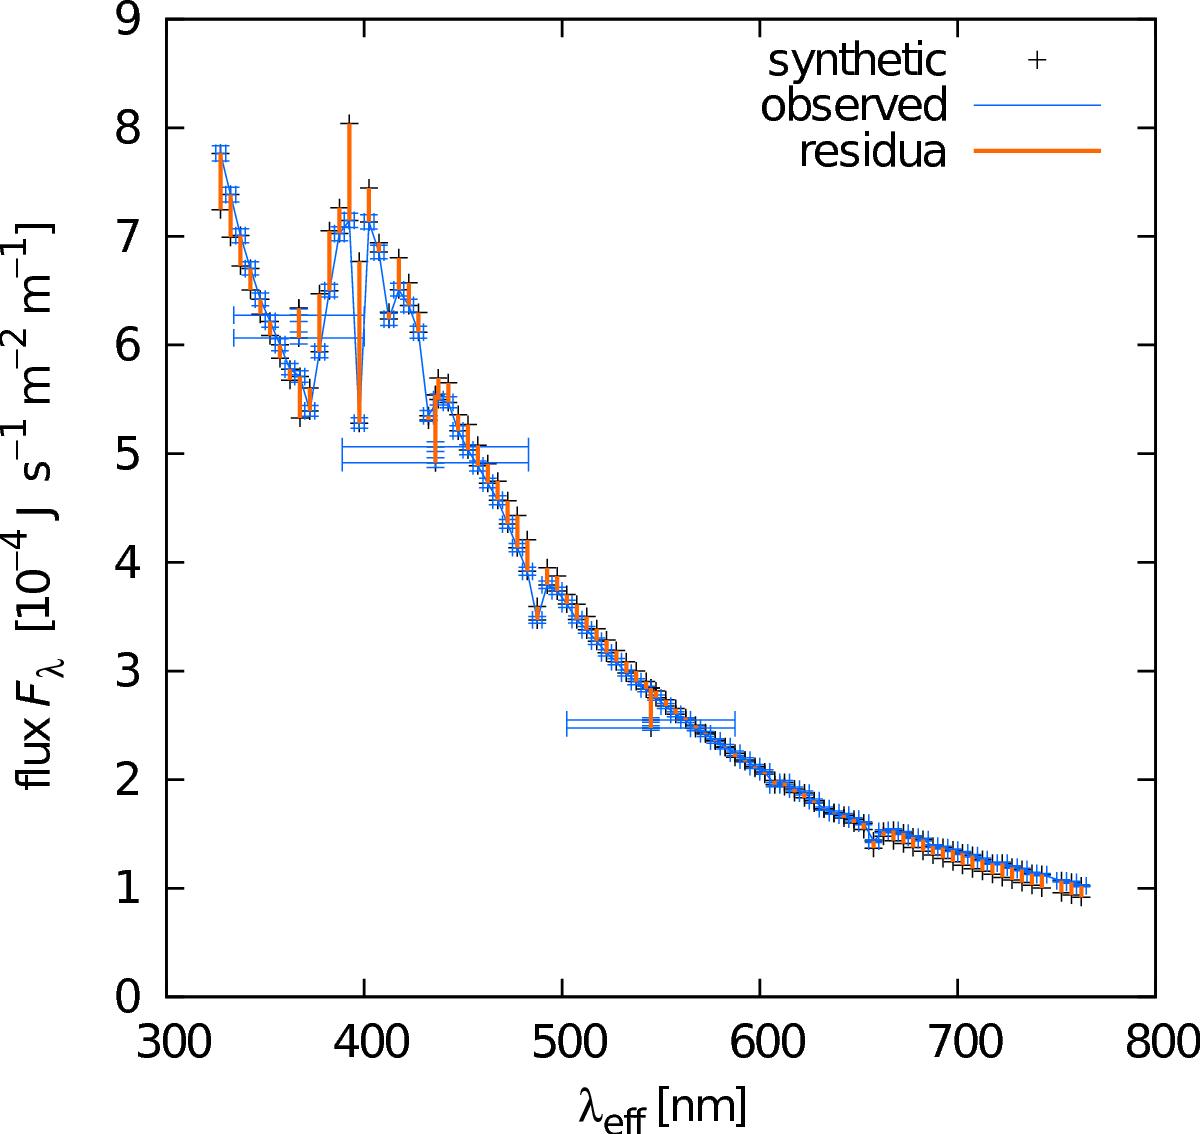
Spectral-energy distribution of V746 Cas expressed as the absolute flux ![]() (in J s-1 m-2 m-1 units; black crosses) and compared with wide-band UBV measurements from Hvar and Geneva, and narrow-band SED measurements by Glushneva et al. (1992). All the data sets were dereddened using E(B−V) = 0
(in J s-1 m-2 m-1 units; black crosses) and compared with wide-band UBV measurements from Hvar and Geneva, and narrow-band SED measurements by Glushneva et al. (1992). All the data sets were dereddened using E(B−V) = 0![]() 060 and standard procedures. While the model seems consistent with U data from Hvar and SED in the region 550 to 650 nm, there are still some systematics in B, V, and both short- and long-wavelength parts of the SED. It is not possible to improve
060 and standard procedures. While the model seems consistent with U data from Hvar and SED in the region 550 to 650 nm, there are still some systematics in B, V, and both short- and long-wavelength parts of the SED. It is not possible to improve ![]() , e.g. by changing temperatures of the components, because it would inevitably increase
, e.g. by changing temperatures of the components, because it would inevitably increase ![]() .
.
Current usage metrics show cumulative count of Article Views (full-text article views including HTML views, PDF and ePub downloads, according to the available data) and Abstracts Views on Vision4Press platform.
Data correspond to usage on the plateform after 2015. The current usage metrics is available 48-96 hours after online publication and is updated daily on week days.
Initial download of the metrics may take a while.