Free Access
Fig. 10
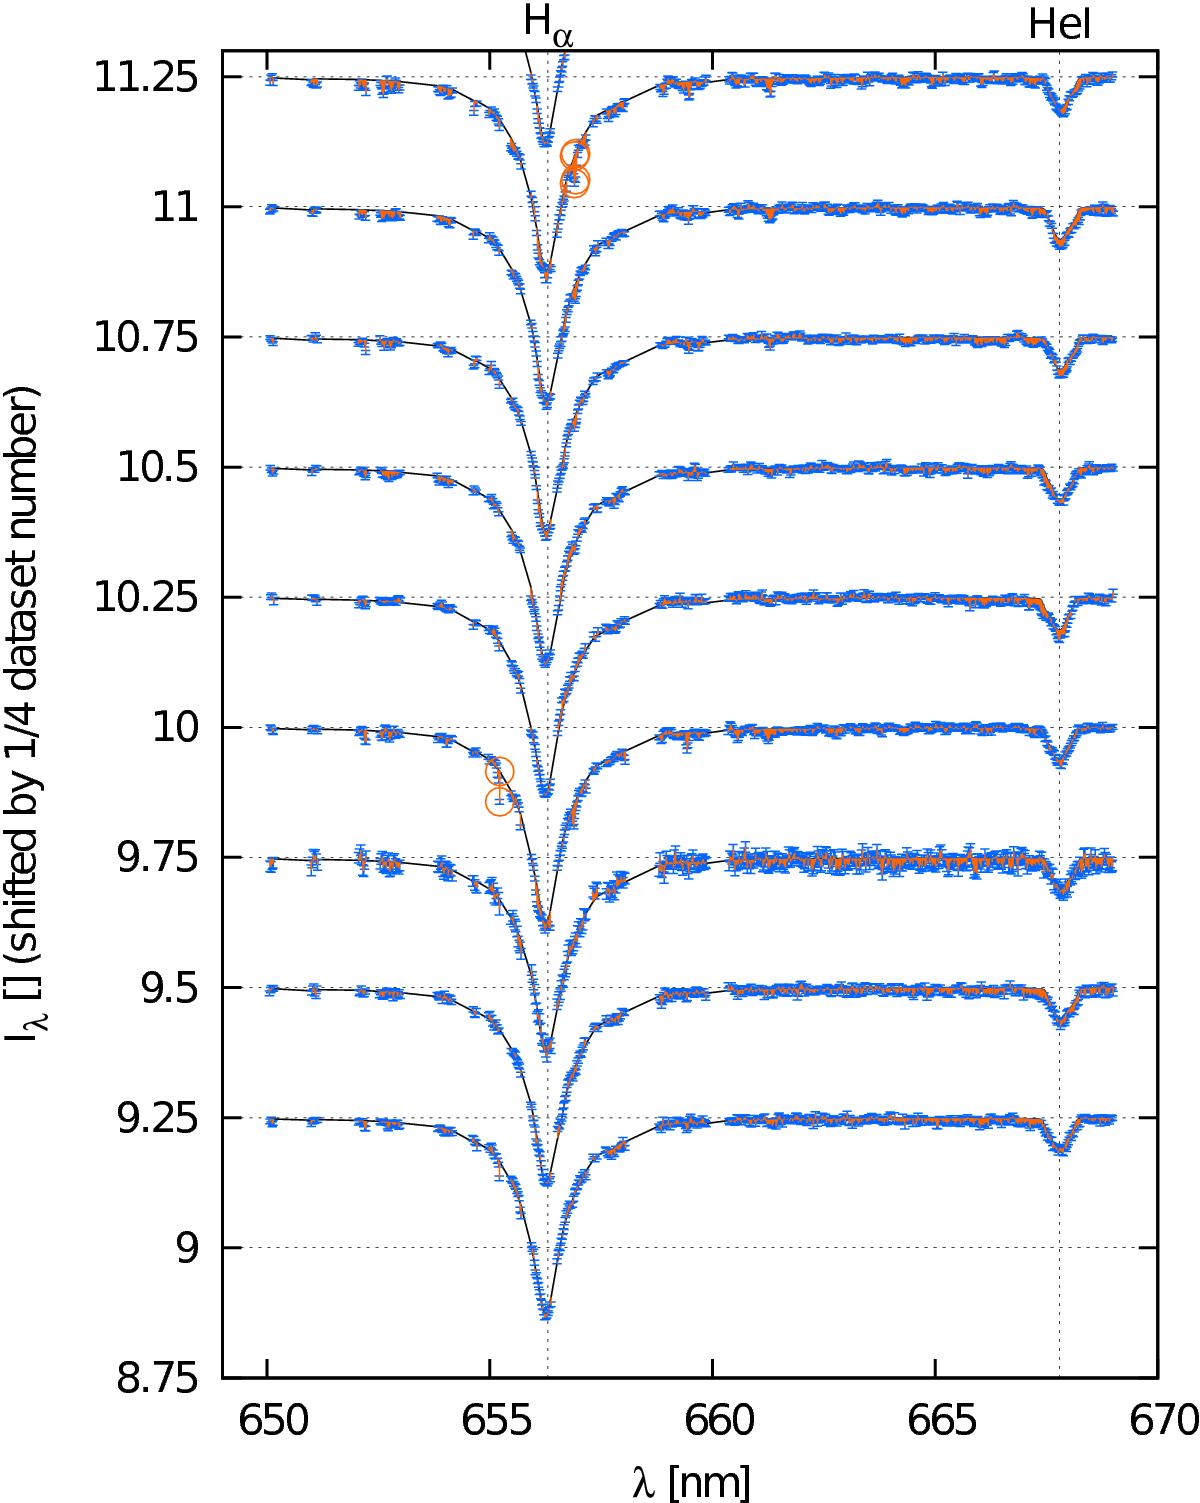
Subset of synthetic spectra ![]() of V746 Cas (black line) for the preferred model with χ2 = 97 733 compared to the normalized observed ones (blue error bars). A region between 650 and 670 nm is shown, with Hα and He i lines. Some parts of the observed spectra were discarded due to the presence of many telluric lines.
of V746 Cas (black line) for the preferred model with χ2 = 97 733 compared to the normalized observed ones (blue error bars). A region between 650 and 670 nm is shown, with Hα and He i lines. Some parts of the observed spectra were discarded due to the presence of many telluric lines.
Current usage metrics show cumulative count of Article Views (full-text article views including HTML views, PDF and ePub downloads, according to the available data) and Abstracts Views on Vision4Press platform.
Data correspond to usage on the plateform after 2015. The current usage metrics is available 48-96 hours after online publication and is updated daily on week days.
Initial download of the metrics may take a while.