Fig. 9
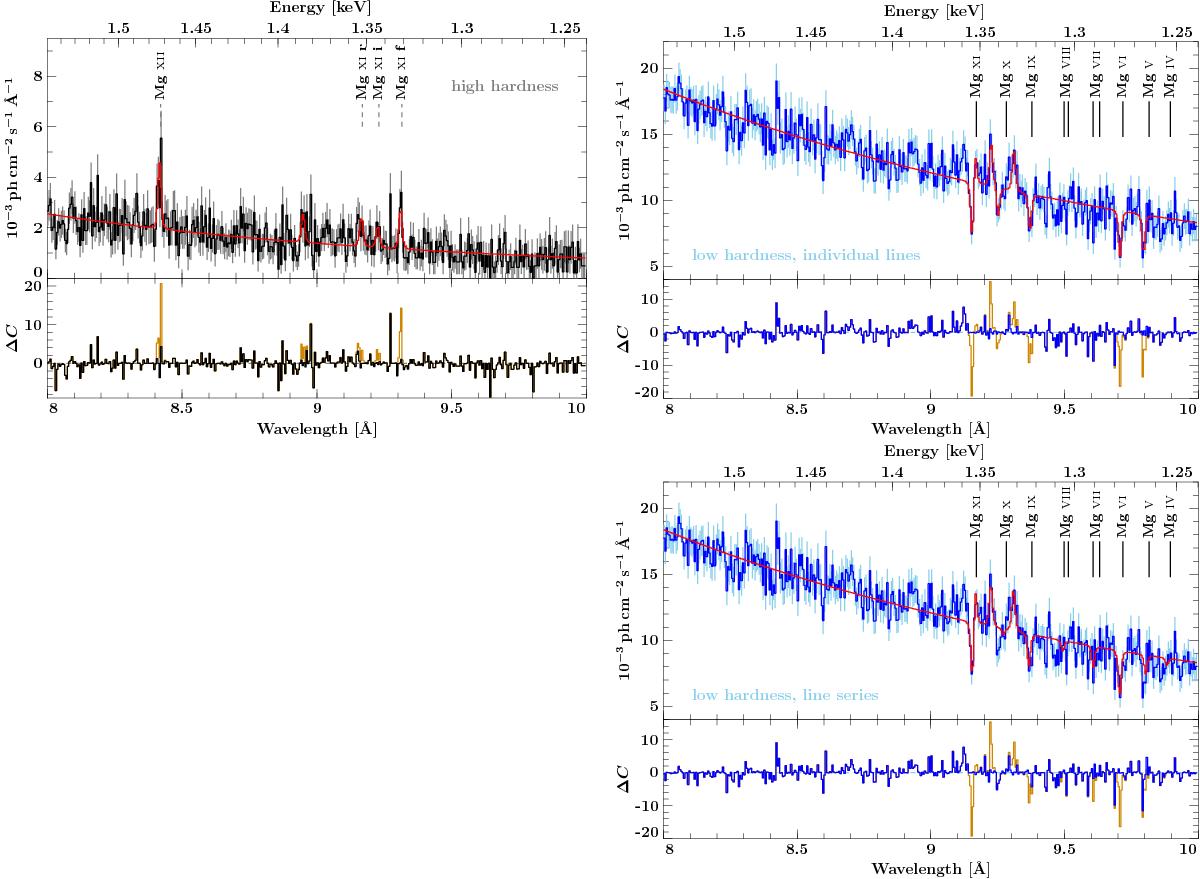
Mg-region spectra of high-hardness (left panel, black) and low-hardness (right panels, blue) periods. Residuals to best fit model are shown in black/blue, residuals to a power law without the line components in orange. The upper right panel shows a fit with five independent absorption lines. The lower right panel shows a fit using a template for Mg-series from Mg xi to iv (reference energies according to Behar & Netzer 2002, indicated by solid lines) with one Doppler shift for all lines. Spectra normalized to their respective power-law continua are shown in Fig. 8. For the high-hardness region, lines identified are indicated and labeled. For the low-hardness region, we refer to the Tables 5 and 6 for the identified lines.

Current usage metrics show cumulative count of Article Views (full-text article views including HTML views, PDF and ePub downloads, according to the available data) and Abstracts Views on Vision4Press platform.
Data correspond to usage on the plateform after 2015. The current usage metrics is available 48-96 hours after online publication and is updated daily on week days.
Initial download of the metrics may take a while.