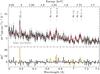
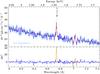
Fig. 7

Si-region spectra of high-hardness (left panel, black) and low-hardness (right panel, blue) periods. Lines identified in the spectra are indicated and labeled. Residuals to the best-fit model are shown in black/blue, and residuals to a power law without the narrow line components are shown in orange. Spectra normalized to their respective power-law continua and reference lab measurements are shown in Fig. 6.
Current usage metrics show cumulative count of Article Views (full-text article views including HTML views, PDF and ePub downloads, according to the available data) and Abstracts Views on Vision4Press platform.
Data correspond to usage on the plateform after 2015. The current usage metrics is available 48-96 hours after online publication and is updated daily on week days.
Initial download of the metrics may take a while.