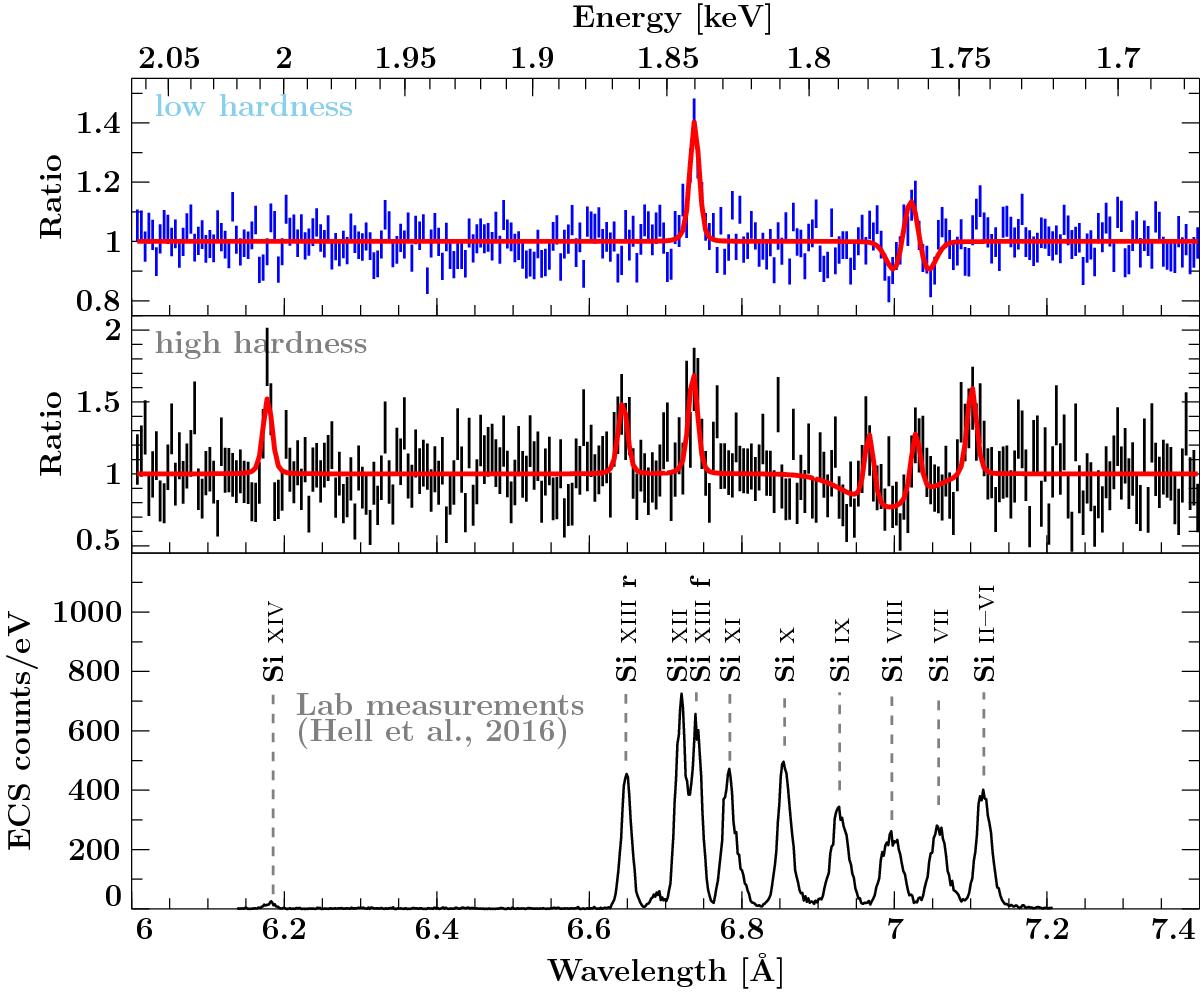
Fig. 6
Silicon region in the low- (upper panel, blue) and high-hardness (middle panel, black) spectra; both panels show combined HEG and MEG ± first order spectra normalized to their respective power-law continua. The solid red line shows the best model fits to the data. Residuals are shown in Fig. 7. The lower panel shows the calibrated and summed NASA/GSFC EBIT Calorimeter Spectrometer (ECS) silicon spectrum used for line identification. These data, as analyzed in Hell et al. (2016), are used as best currently available laboratory reference values for the energies of K-shell transitions in L-shell ions of Si.
Current usage metrics show cumulative count of Article Views (full-text article views including HTML views, PDF and ePub downloads, according to the available data) and Abstracts Views on Vision4Press platform.
Data correspond to usage on the plateform after 2015. The current usage metrics is available 48-96 hours after online publication and is updated daily on week days.
Initial download of the metrics may take a while.