Free Access
Fig. 3
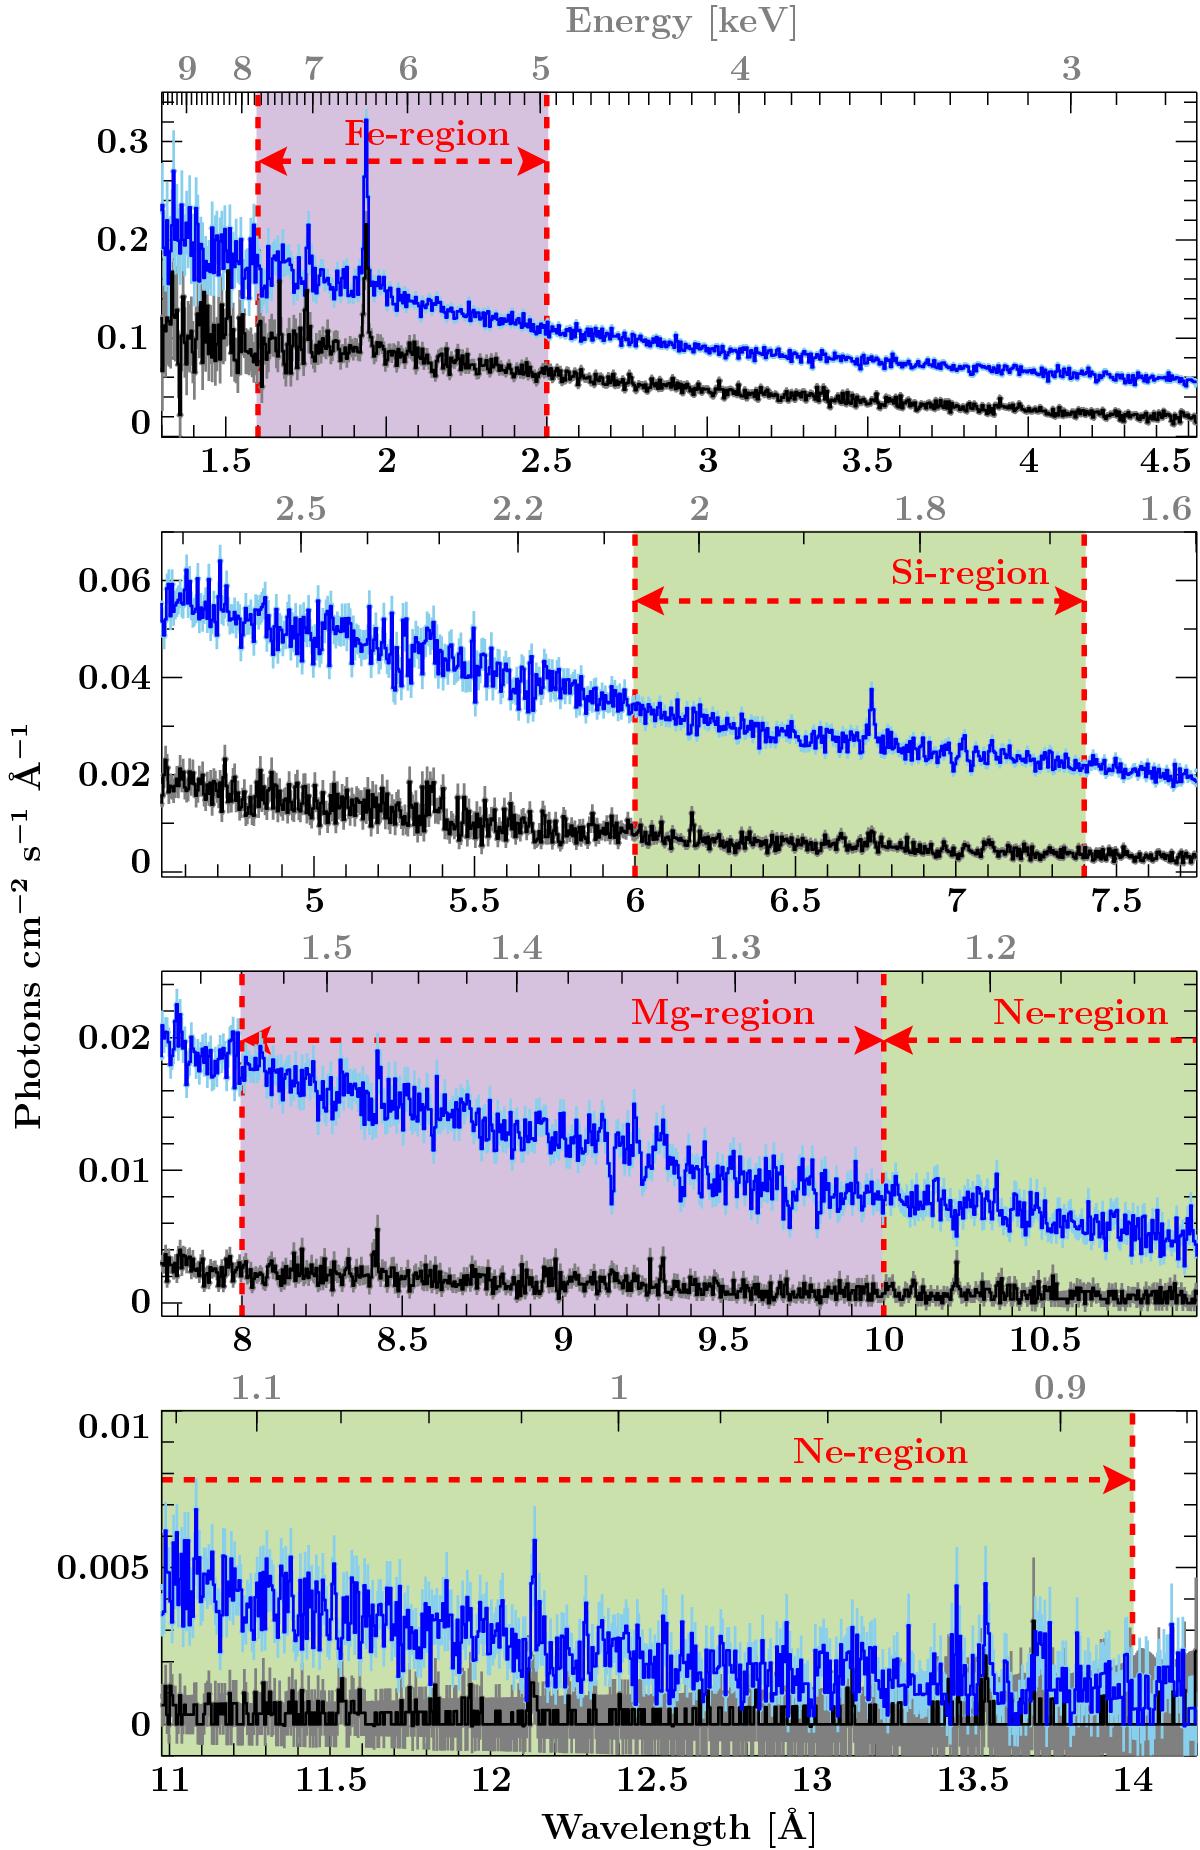
Vela X-1 spectra from ObsID 1928 from low- (blue) and high-(black) hardness phases, HEG and MEG combined and rebinned by a factor of 2. Red dashed lines indicate the borders of the four regions (shaded) used in the local power law fits in Sect. 3.
Current usage metrics show cumulative count of Article Views (full-text article views including HTML views, PDF and ePub downloads, according to the available data) and Abstracts Views on Vision4Press platform.
Data correspond to usage on the plateform after 2015. The current usage metrics is available 48-96 hours after online publication and is updated daily on week days.
Initial download of the metrics may take a while.