Fig. 12
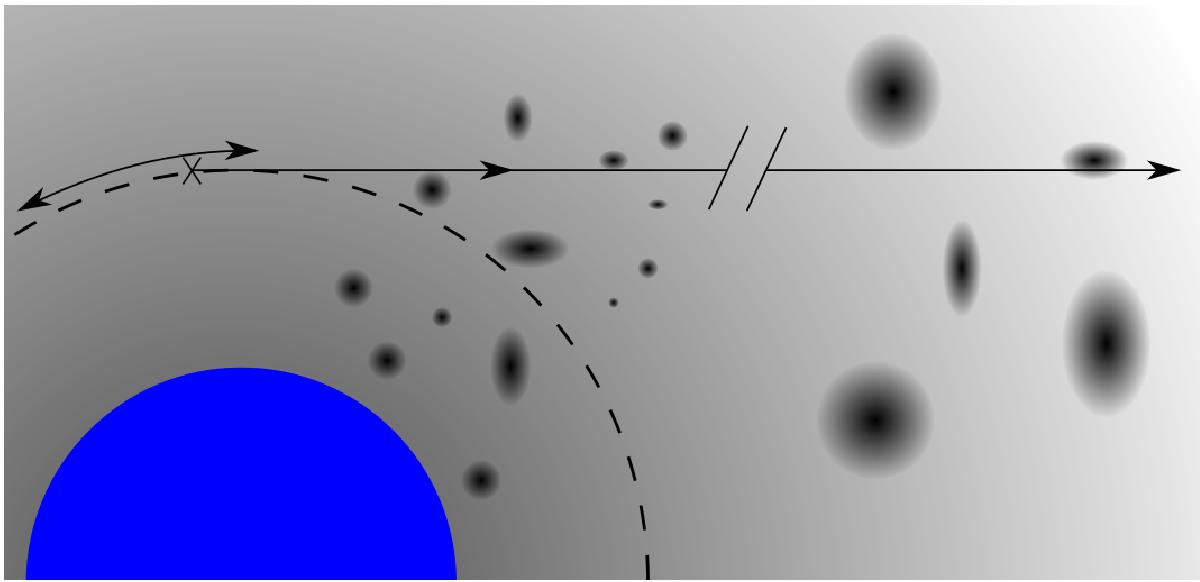
Illustration (not to scale) of the computation in Sect. 4.1. The inhomogeneous wind induces a time-variable column density on the line of sight (solid line) as the constant X-ray flux point source (cross) orbits the star (in blue) at φorb = 0.21–0.25 (arc interval). The overdense regions are fiducially represented using radially fading spheroidal black dots and the inter-clump environment using a smoothly decaying spherical profile.
Current usage metrics show cumulative count of Article Views (full-text article views including HTML views, PDF and ePub downloads, according to the available data) and Abstracts Views on Vision4Press platform.
Data correspond to usage on the plateform after 2015. The current usage metrics is available 48-96 hours after online publication and is updated daily on week days.
Initial download of the metrics may take a while.