Fig. 8
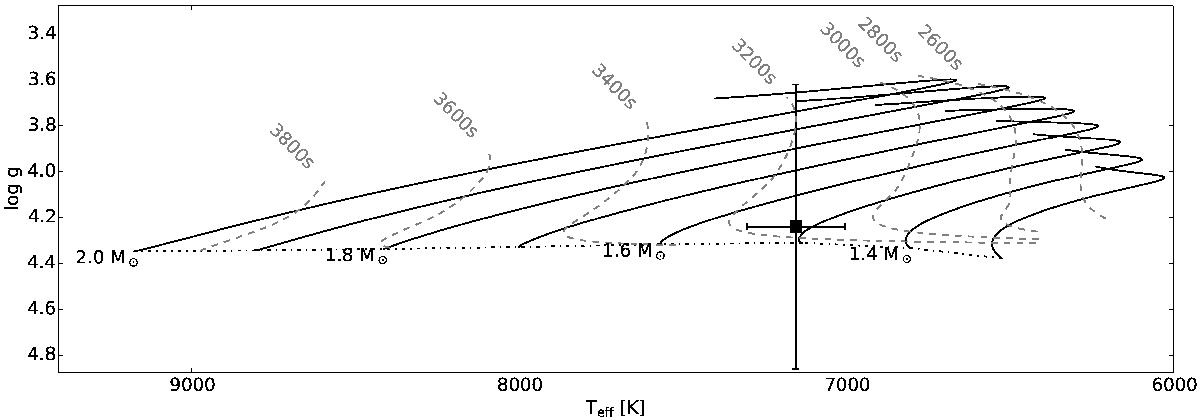
Location of 43 Cyg (black square) in a Kiel diagram. The evolution tracks (full black lines) have been computed with MESA v7385, assuming solar metallicity and exponential overshooting fov = 0.015. The zero-age main sequence (black dash-dotted line) and the values of the asymptotic spacing ΔΠl = 1 (grey dashed lines) are also shown.
Current usage metrics show cumulative count of Article Views (full-text article views including HTML views, PDF and ePub downloads, according to the available data) and Abstracts Views on Vision4Press platform.
Data correspond to usage on the plateform after 2015. The current usage metrics is available 48-96 hours after online publication and is updated daily on week days.
Initial download of the metrics may take a while.