Fig. 7
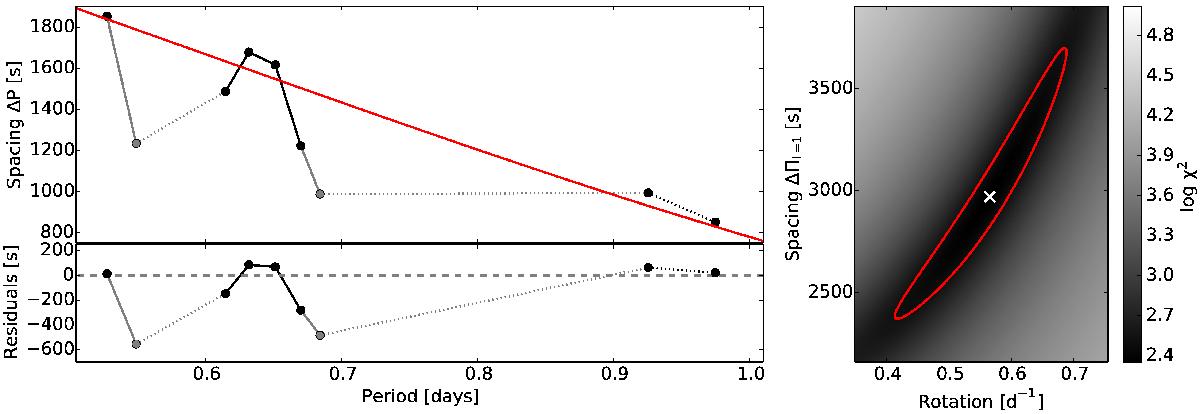
Top left: observed period spacing pattern (black) with the best asymptotic model pattern (full red line). The largest dips in the pattern (grey) were not taken into account for the model fit. Bottom left: residuals of the model fit to the observed period spacings. Right: χ2-landscape of the fit, with the location of the best model (white cross) and the 1σ confidence region (red contour).
Current usage metrics show cumulative count of Article Views (full-text article views including HTML views, PDF and ePub downloads, according to the available data) and Abstracts Views on Vision4Press platform.
Data correspond to usage on the plateform after 2015. The current usage metrics is available 48-96 hours after online publication and is updated daily on week days.
Initial download of the metrics may take a while.